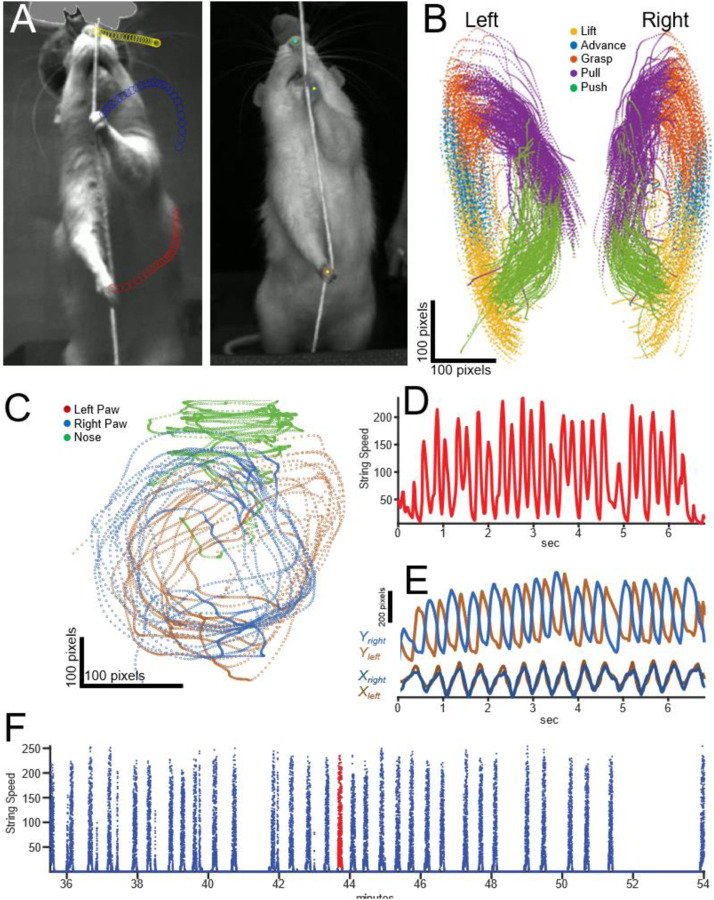
Figure 1.
Video Tracking and Behavioral Data: A) Still photos from video recordings of two rats acquired during separate recording sessions. Dots on the left photo indicate automated tracking of the nose and paws using DeepLabCut. B) Paw tracking and automatic segmentation of the 5 phases of string pulling (lift, advance, grasp, push, pull) for a 20-minute behavioral session (33 bouts). Plots for the left and right paw are separated by 100 pixels in the x dimension to improve visualization (to limit overlap). CE) Trajectories for a single 7s bout of string pulling. C) Paw and nose tracking during a single 7-second pulling bout. X data is expanded relative to Y (see scale bars) to improve visualization of the left and right paw. D) String speed as measured from the rotary encoder during the 7-second bout. E) X and y position of each paw during the 7-second bout. F) String speed through the entire 20-minute training session with each bout indicated as a spike in speed. Red indicates the bout presented in plots C-E.

