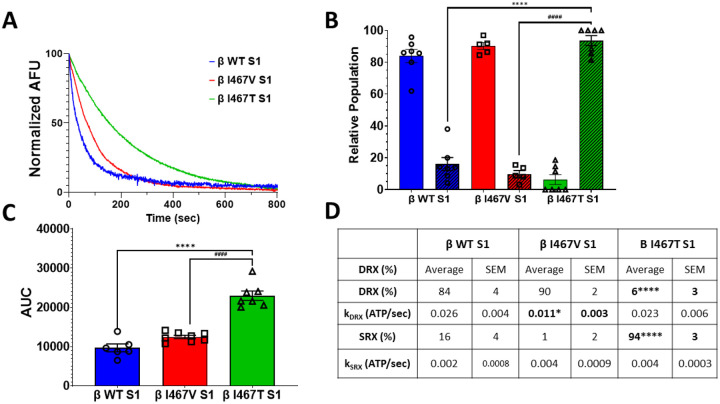
Figure 2. Single turnover ATPase assay of myosin S1.
(A) Representative double-exponential fluorescence decay curves from the single-turnover mant-ATP dependent ATPase assay for myosin S1 constructs (WT: blue, β-I467V: red, β-I467T: green). (B) The disordered (DRX, solid bars) and super-relaxed (SRX, dashed lines) states were calculated from the double-exponential fit of decay curves. (C) Area under the curve (AUC) was calculated for each decay curve. (D) Summary table of the single turnover assay measurements. ATPase rates associated with the DRX and SRX states (kDRX and kSRX, respectively) were calculated from the double exponential decay fits. Values are calculated from 5–7 decay curves per mutation. Data are represented as mean ± SEM. A one-way ANOVA was used to assess statistical significance (* = p<0.05 vs. β-WT S1) and adjusted with Tukey’s multiple comparisons to assess differences between mutations (# = p<0.05 vs. β-I467V S1). N= 5–7 curves per myosin S1 construct.

