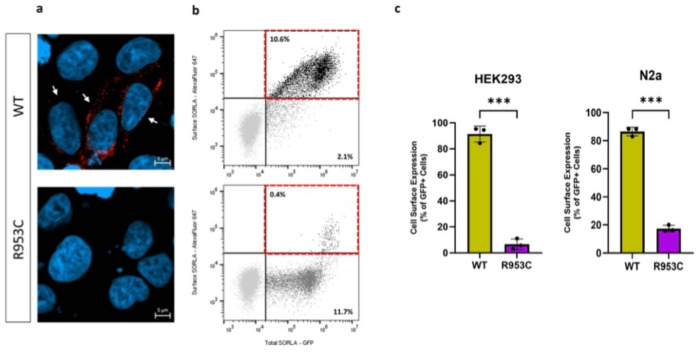
Figure 6. SORL1 R953C cells have reduced SORL1 protein localization on the cell surface.
(a) Representative immunocytochemistry from HEK293 cells transiently transfected with SORLA-WT or SORLA-R953C expression construct and stained for SORLA (red) at the cell surface. White arrows show positive cells. (b) Flow cytometry dot plot showing surface (AlexaFluor 647 fluorescence) and total (GFP fluorescence) in live single HEK293 cells expressing WT-GFP and R953C-GFP. Vertical and horizontal lines represent thresholds for GFP and AlexaFluor 647-positive cells, respectively. Represented are GFP-positive cells with AlexaFluor 647 signal above (black, inside red dashed gate) or below threshold (dark grey); and untransfected cells (light grey). Numbers in the plots represent the percentages of the cells inside the gates. (c) Bar plots of AlexaFluor 647 fluorescence in HEK293 and N2a cells expressing WT-GFP or R953C-GFP, generated from population of GFP-positive cells. n=3 independent experiments. Results are expressed as Mean± SD and analyzed by parametric two-tailed paired t-test. Significance was defined as a value of ***p<0. 001.

