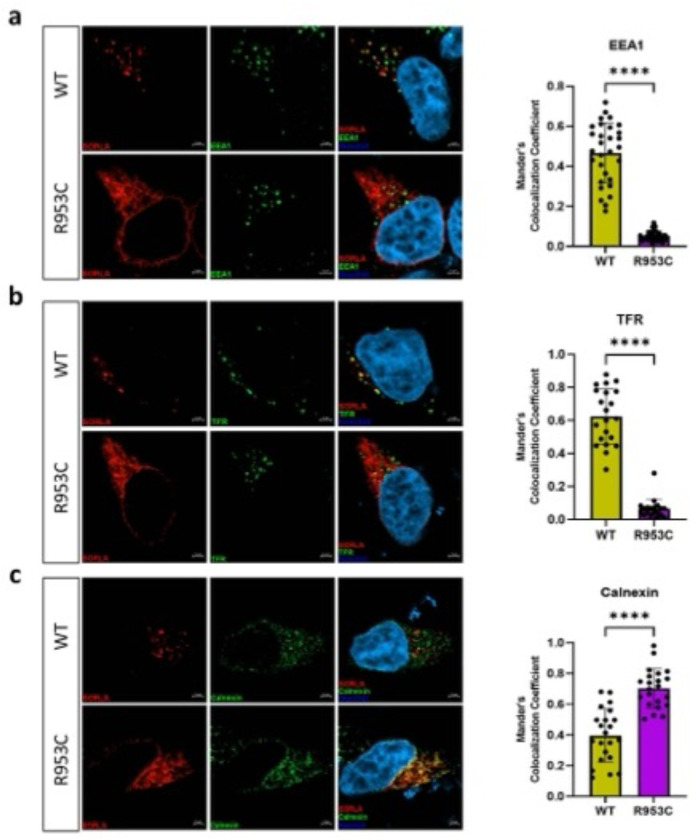
Figure 7. SORL1 R953C cells have reduced localization of the SORL1 protein in early and recycling endosomes.
HEK293 cells transiently expressing WT or R953C (red) are shown for their colocalization with (a) EEA1 (early endosomal marker), (b) TFR (recycling endosomal marker), and (c) Calnexin (ER marker) (green). The nuclei were visualized with Hoechst (blue). Bar graphs on the right panel illustrate quantifications of colocalization between WT and R953C in cells co-stained for (a) EEA1, (b) TFR and (c) Calnexin. In all cases, the quantification of colocalization was represented as Mander’s correlation coefficient. 20-30 images per condition were analyzed. Data are shown as mean±SD and analyzed by parametric two-tailed unpaired t-test. Significance was defined as a value of ****p<0.0001.

