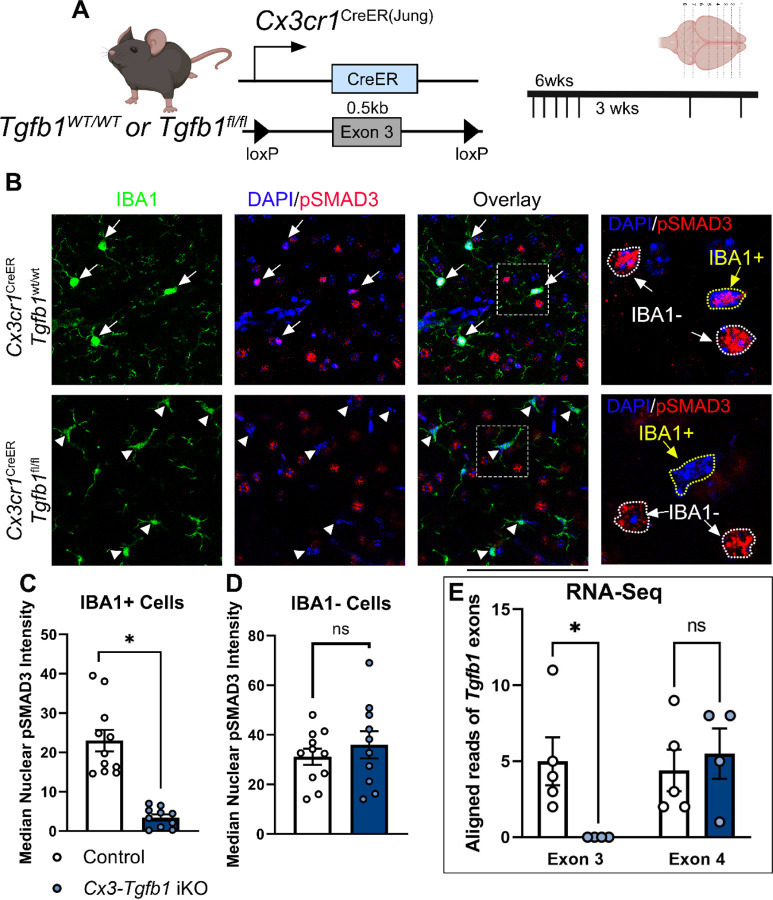
Figure 1. Validation of loss of Tgfb1 loxP-flanked exon 3 in microglial mRNA and the TGF-β downstream signaling effector (pSMAD3) in Cx3cr1CreER(Jung)Tgfb1fl/fl iKO mice following tamoxifen administration.
(A) Mouse model used and experimental timeline. (B) Representative IHC showing pSMAD3, IBA1, and DAPI in control animals and iKO animals. (C,D) Quantification of pSMAD3 nuclear immunoreactivity median intensity in both IBA1+ cells (C) and IBA1− cells (D). (E) Based on RNAseq analysis of sorted MG from Control or Cx3cr1CreER(Jung)Tgfb1fl/fl iKO mice, aligned reads that matched to exon3 (the loxP-flanked exon) or exon4 (the exon downstream of the floxed exon) show that exon 3 is significantly lower in MG-Tgfb1 iKO microglia compared to control microglia while exon 4 is unaffected. Mean±SE, * = p<0.05. Student’s t-test. Scale bar = 100µm. SMAD3 bar graphs show individual image averages, however statistics were carried out using the average cell intensity for a single animal (control n=4, iKO n=3). RNA-seq graph shows a single data point per animal.

