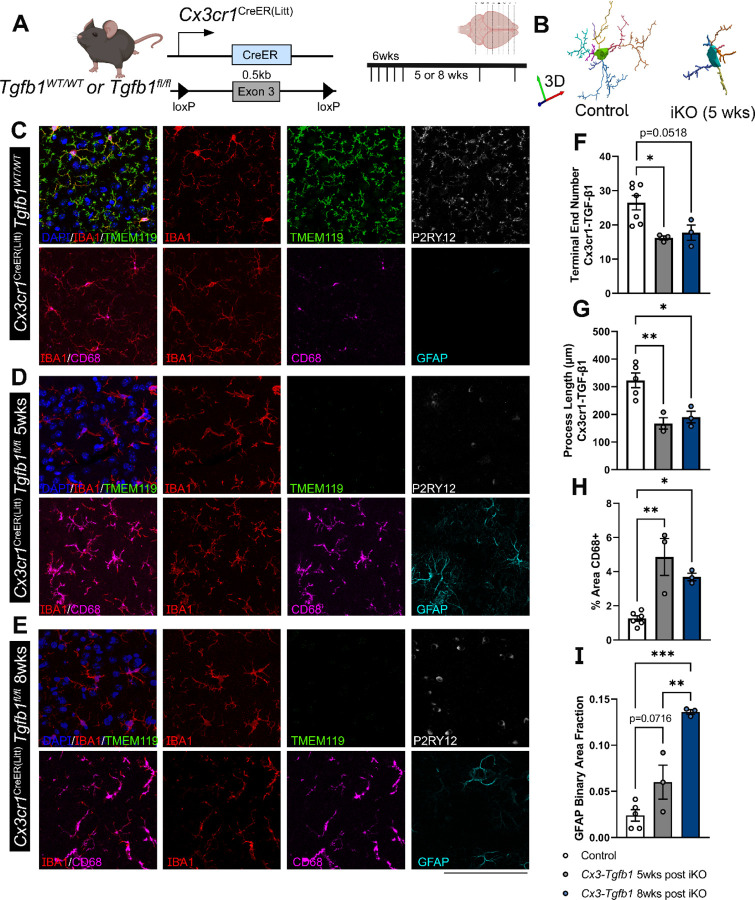
Figure 2. Microglia-specific Tgfb1 gene deletion results in loss of homeostasis of microglia and in increased reactive astrocytes in cortex of the adult mouse brain.
(A) Mouse model for targeting microglial Tgfb1 and timeline. (B) 3D reconstruction of control and iKO microglia. Representative immunohistochemistry images of IBA1, TMEM119, P2RY12, CD68, and GFAP in the cortex of (C) Control animals, (D) Cx3cr1CreER(Litt)Tgfb1fl/fl knockouts 5 weeks after tamoxifen administration, and (E) Cx3cr1CreER (Litt)Tgfb1fl/fl knockouts 8 weeks after tamoxifen administration. Quantification of (F) total microglial process length, (G) microglial process terminal end numbers, (H) % of CD68 immunoreactive positive area, and (I) GFAP immunoreactive positive area fraction. Mean±SE, * = p<0.05, ** = p<0.01, *** = P<0.001. Student’s t-test. ( > 40 microglia were quantified for each animal and the average from one mouse was plotted as a single data point in the figure panel and treated as n=1 for statistical analysis). Scale bar = 100µm.

