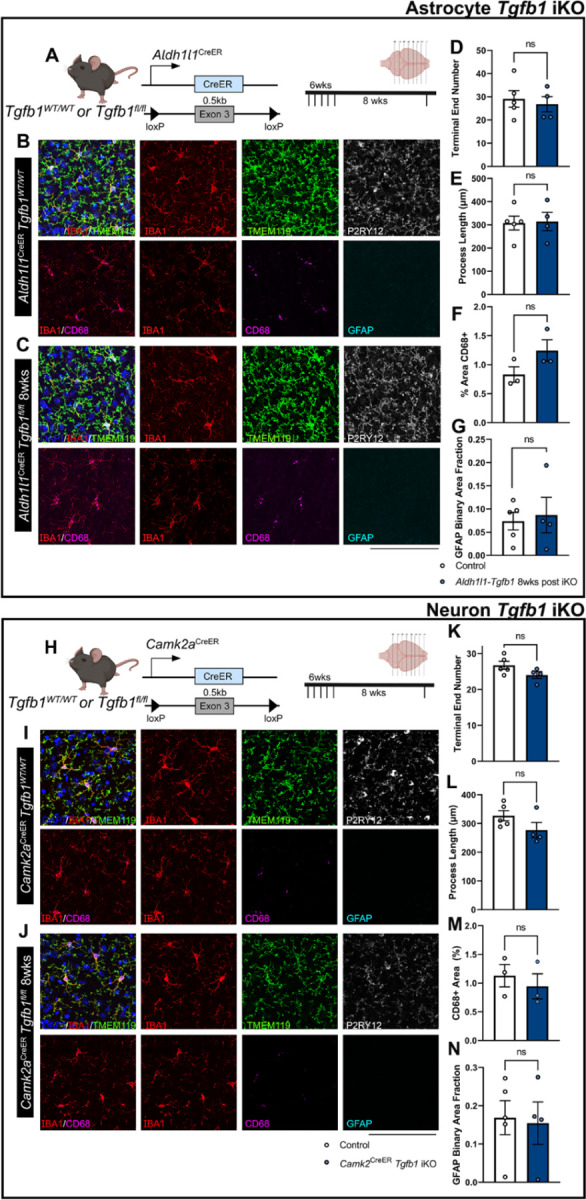
Figure 3. Astrocyte-specific or forebrain neuronal specific Tgfb1 gene deletion in the Aldh1l1CreER or Camk2aCreER drivers does not affect the homeostasis of microglia or GFAP expression in astrocytes in adult mouse brain (cortex).

(A) Astrocyte iKO mouse model and experimental timeline. (B, C) Representative immunohistochemistry images of cortex from TAM treated (8 weeks post) control (B) Aldh1l1CreERTgfb1wt/wt and (C) iKO Aldh1l1CreER Tgfb1fl/fl tissue showing IBA1, TMEM119, P2RY12, CD68, and GFAP immunostaining. Quantification of microglia ramification via (D) process terminal end numbers, (E) total process length, and (H) % of CD68+ immunoreactive area. (G) quantification of astrocyte reactivity using GFAP immunoreactive positive area fraction. (H) Neuronal iKO mouse model and experimental timeline. (I, J) Representative images of TAM treated (8 Weeks post) control Camk2aCreERTgfb1wt/wt (I) and iKO Camk2CreER Tgfb1fl/fl tissue showing IBA1, TMEM119, P2RY12, CD68, and GFAP immunoreactivity. Quantification of microglia ramification via (K) process terminal end number, (L) total process length, and (M) CD68+ immunoreactive % area. (N) Quantification of astrocyte reactivity using GFAP+ immunoreactive area fraction. Mean±SE ( > 40 microglia were quantified for each animal and the average from one mouse was plotted as a single data point in the figure panel and treated as n=1 for statistical analysis). ns=not significant., Scale bar = 100µm.
