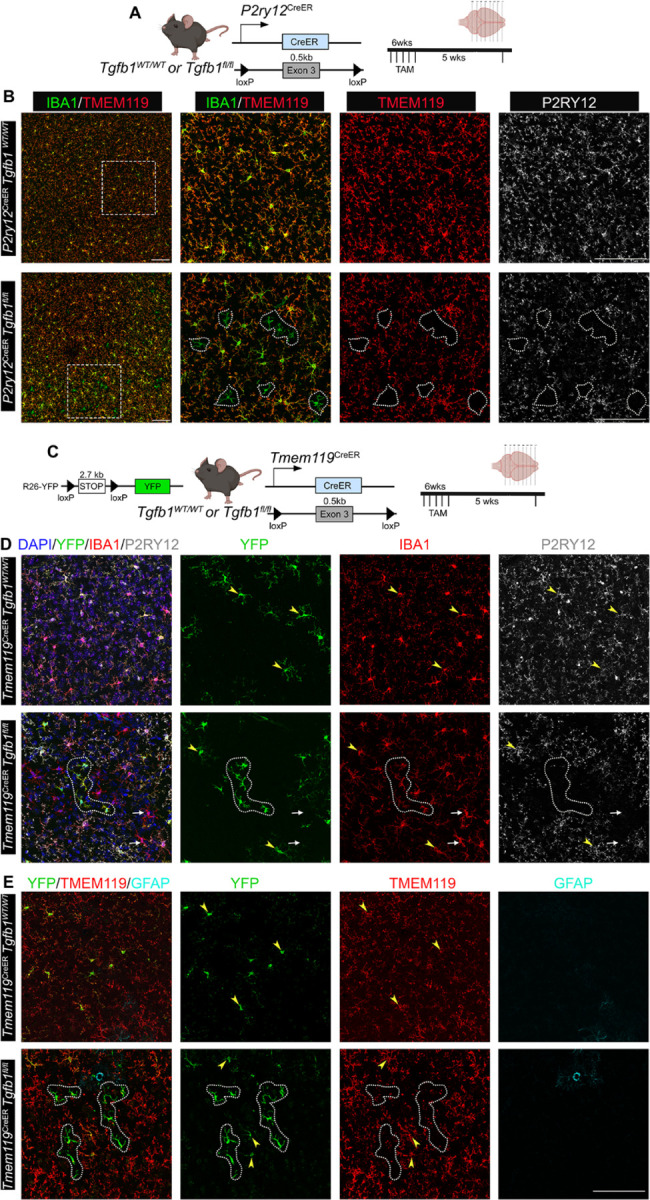
Figure 4. Mosaic deletion of Tgfb1 gene in subsets of parenchyma microglia in the P2ry12creER Tgfb1 fl/fl or the Tmem119CreERTgfb1fl/fl iKO mice leads to distinct patches of dyshomeostatic microglia in the adult mouse brain.

(A) P2ry12CreER mouse driver to induce Tgfb1 KO in P2RY12+ microglia and experimental timeline. We recently showed that these lines have a 50% decrease in exon3 of Tgfb1 mRNA in reporter positive microglia25. (B) TAM treated (5 weeks post) Control and P2ry12CreERTgfb1 fl/fl iKO representative images showing immunohistochemistry for IBA1, TMEM119, and P2RY12. (C) Tmem119CreER mouse driver to induce tgfb1 KO in TMEM119+ microglia and experimental timeline. (D) TAM treated (5 weeks post) Control and Tmem119creERTgfb1 fl/fl iKO representative images showing immunohistochemistry for YFP, IBA1, P2RY12 and (E) YFP, TMEM119, and GFAP immunostaining. White dotted outlines indicate microglia with downregulated TMEM119 and/or P2RY12 expression. White arrows depict YFP− cells that also show loss of P2RY12 expression. Yellow arrowheads show YFP+ cells in either WT or iKO mice that still maintained P2RY12 or TMEM119 expression. Representative results from n=3–5 mice/group. Scale bar = 100µm.
