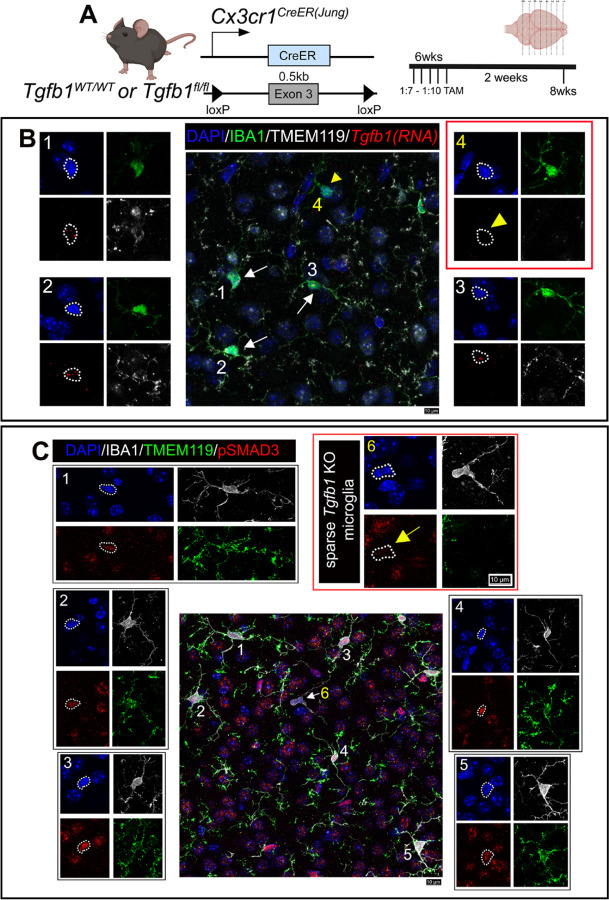
Figure 6. In-situ RNA-scope and IHC double labeling confirm loss of Tgfb1 RNA and downregulation of TGF-β downstream signaling (pSMAD3) in dyshomeostatic individual microglia in the sparse Tgfb1 iKO model.
(A) The mouse model used to examine sparse iKO in microglia and experimental timeline with TAM dosage. (B) Representative image showing combined immunohistochemistry staining (for IBA1, TMEM119, DAPI) and Tgfb1 RNA-scope hybridization. (B1–3) Surrounding normal microglia showing TMEM119 expression and Tgfb1 RNA presence. (B4) A single microglia cell with loss of TMEM119 expression and loss of Tgfb1 mRNA. White arrows were used to mark normal cells in the central panel. Yellow arrowhead used to mark individual iKO microglia. Note that tissue treatment for RNAscope analysis makes the IHC condition less ideal for morphology evaluation than regular IHC staining, however, IBA1 and TMEM119 expression are still distinguishable for individual WT or iKO microglia. (C) Representative image showing co-immunohistochemical staining with DAPI, IBA1, TMEM119, and pSMAD3. (C1–5) Surrounding normal microglia showing TMEM119 expression and pSMAD3 immunostaining. (C6) A single microglia cell with loss of TMEM119 expression and loss of pSMAD3 labeling. The yellow arrow (microglia #6) marks the individual iKO microglia. Representative results from n=3 iKO mice. Scale bar = 10µm. For additional representative images see Supplementary Figs 10 and 11.

