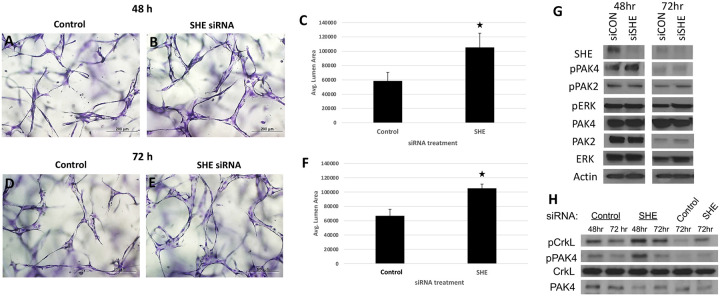
Figure 9. Inhibition of SHE in HUVECs results in enlarged tubulogenesis.
(A-F) HUVEC cells were transfected with either control or SHE siRNA and analyzed in 3D collagen matrix assay at 48 (A-C) or 72 h (D-F) after transfection. The values (± standard deviation) are derived from analyzed fields (n=15) where total EC tube area was measured. Asterisks indicate significance at p<0.05 compared to control conditions.
(G,H) Western blots for expression of SHE and phosphorylation of PAK4, PAK2, ERK and CRKL in HUVEC cells transfected with a control or SHE siRNA. Note greatly reduced SHE expression and increased pPAK4 and pCRKL in cells transfected with siSHE RNA. (H) shows replicate experiments for pPAK4 and pCRKL.

