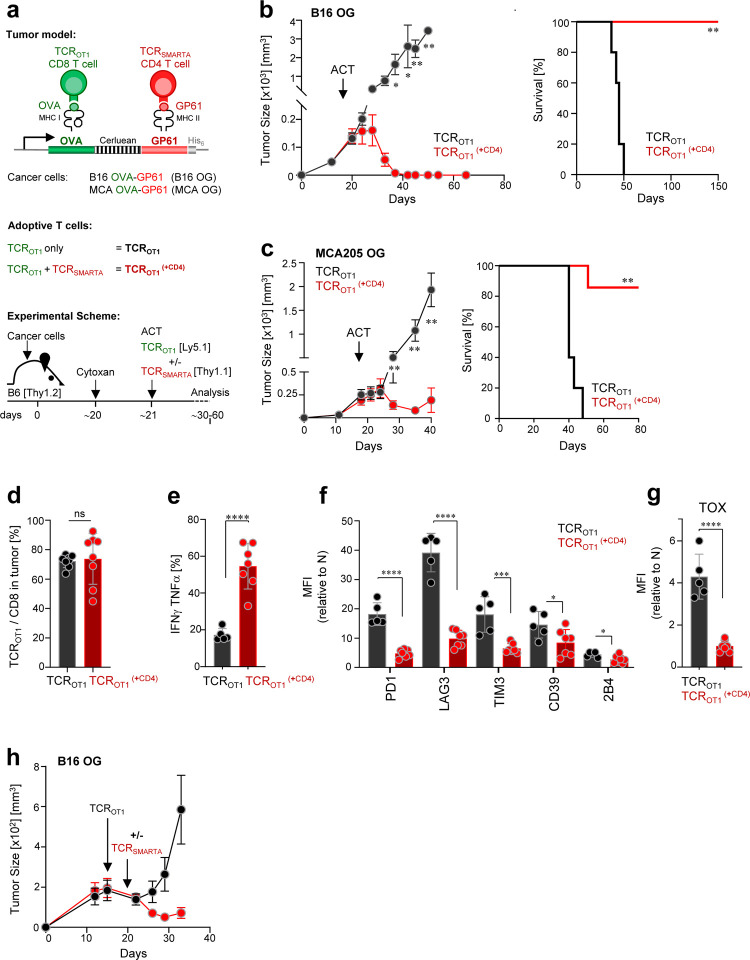
Figure 1 |. Tumor-specific CD4 T cells prevent and reverse CD8 T cell dysfunction/exhaustion within solid tumors and mediate tumor elimination.
a. Scheme: tumor models, adoptively transferred effector T cells, and experimental schemes. b. B16 OVA-GP61–80 (B16-OG) tumor growth (right) and Kaplan–Meier survival curve (left) of tumor-bearing B6 WT mice (CD45.2; Thy1.2) receiving effector TCROTI CD8 T cells alone (CD45.1) (black; TCROT1) or together with TCRSMARTA CD4 T cells (Thy1.1) (red; TCROT1(+CD4)) (ACT = adoptive T cell transfer). Data is representative of 5 independent experiments (n=5 mice/group). Values are mean ± SEM. Significance is calculated by multiple t test. Kaplan–Meier curve; **p=0.00021; Mantel–Cox test. c. MCA205 OVA-GP61–80 (MCA-OG) tumor outgrowth and survival in B6 mice treated as described in b; **p=0.0003; Mantel–Cox test. Data is representative of 2 independent experiments (n=5–6 mice/group). d. TCROTI (% of total of CD8+ T cells) within progressing B16-OG tumors 8–9 days post transfer +/− TCRSMARTA CD4 T cells. Data pooled from 2 independent experiments (n=8 mice/group). Each symbol represents an individual mouse. e. IFNγ and TNFα production of TCROTI isolated from B16-OG tumors 8–9 days post transfer +/− TCRSMARTA CD4 T cells. Cytokine production was assessed after 4-hr peptide stimulation ex vivo. Data show 2 pooled independent experiments (n=5–7). f. Inhibitory receptor expression, and g. TOX expression of B16-OG tumor-infiltrating TCROTI isolated 8–9 days post transfer +/− TCRSMARTA. Graphs depict relative MFI normalized to naive TCROTI; two pooled independent experiments (n=5–7mice/group). h. Mice with B16-OG tumors received effector TCROTI CD8 T cells 14 days post tumor transplantation; 9 days later, TCRSMARTA CD4 T cells were adoptively transferred (red); B16-OG tumor growth in mice receiving only TCROT1 are shown in black. Data is representative of 2 independent experiments (n=8 mice/group). Values are mean ± SEM. Significance is calculated by multiple t test.

