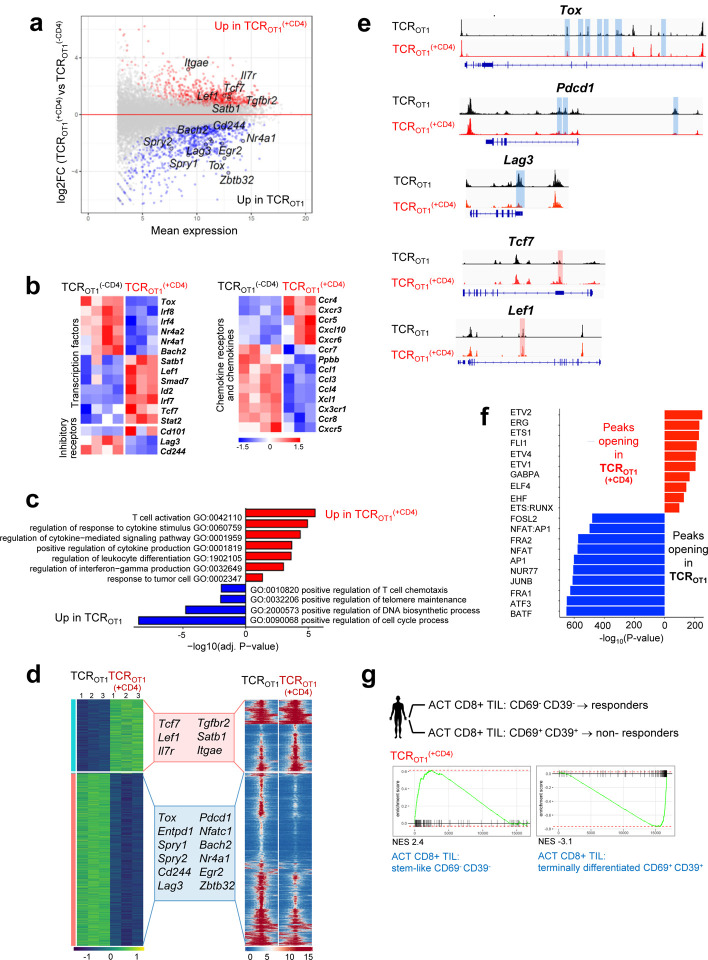
Figure 2 |. Tumor-specific CD4 T cells transcriptionally and epigenetically reprogram tumor-specific CD8 T cells and prevent terminal differentiation/exhaustion.
a. MA plot of RNA-seq data showing the relationship between average expression and expression changes of TCROT1 and TCROT1(+CD4) TIL.Statistically significantly DEGs (false discovery rate (FDR) < 0.05) are shown in red and blue, with select genes highlighted for reference. b. Heat map of RNA-seq expression (normalized counts after variance stabilizing transformation, centered and scaled by row for DEGs) (FDR < 0.05) in TCROT1 and TCROT1(+CD4) TIL. c. Selected GO terms enriched for genes up-regulated in TCROT1 (blue) and TCROT1(+CD4) (red) TIL. d. Chromatin accessibility (ATAC-seq); (left) heatmap of log2-transformed normalized read counts transformed with variance stabilization per for regions with differential chromatin accessibility; (right) each row represents one peak (differentially accessible between TCROT1 and TCROT1(+CD4) TIL; FDR < 0.05) displayed over a 2-kb window centered on the peak summit; regions were clustered with k-means clustering. Genes associated with the two major clusters are highlighted. e. ATAC-seq signal profiles across the Tox, Pdcd1, Lag3, Tcf7, and Lef1 loci. Peaks significantly lost or gained are highlighted in red or blue, respectively. f. Top 10 most-significantly enriched transcription factor motifs in peaks with increased accessibility in TCROT1(+CD4) TIL (red) or TCROT1 TIL (blue). g. Enrichment of gene sets in TCROT1 and TCROT1 (+CD4), respectively, described for human tumor infiltrating (TIL) CD8 T cell subsets (CD69- CD39) stem-like CD8 T cells/TIL (responders) or (CD69+ CD39+) terminally differentiated CD8 T cells/TIL (non-responders) from metastatic melanoma patients receiving ex vivo expanded TIL for ACT (S. Krishna et al, Science 2020). TCROT1(+CD4) are enriched in genes observed in CD69- CD39- stem-like T cells/TIL from responders in contrast to TCROT1 which are positively enriched for genes in CD69+ CD39+ terminally differentiated CD8 T cells/TIL from non-responders. NES, normalized enrichment score.

