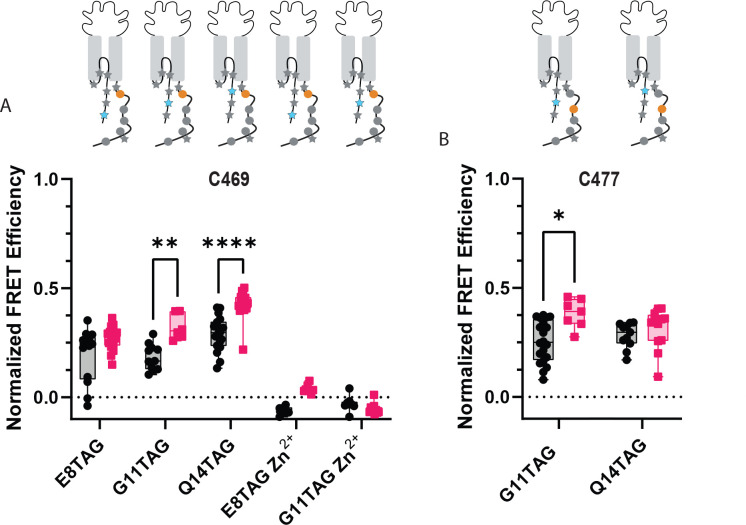
Figure 6. ACCuRET reveals the NTD and CTD likely do not form a complex at rest.
(A) Normalized FRET efficiency between L-ANAP on the NTD and Cu2+-TETAC at position C469 at pH 8 (black) and pH 6 (red). FRET efficiencies, SEM, N and calculated distances are summarized in Table 1. Zn2+-TETAC negative control for positions E8 and G11 shows that the changes in signal measured with Cu2+-TETAC are due the presence of Cu2+ and not due to any other changes. (B) Normalized FRET efficiency between L-ANAP on the NTD and Cu2+-TETAC at position C477 at pH 8 (black) and pH 6 (red). The inset cartoons show the position of L-ANAP denoted by a red star and the single cysteine denoted by a green circle. Box and whisker plot with whiskers ranging from minimum to maximum values and the bottom and top edges of the box denoting the 25th and 75th quartiles, respectively. Statistical significance shown using two-way ANOVA with Tukey’s multiple comparisons test are denoted between relevant comparison using appropriate asterisks. Ns indicates p > 0.05, * indicates p ≤ 0.05, ** indicates p ≤ 0.01, *** indicates p ≤ 0.001, **** indicates p ≤ 0.0001.

