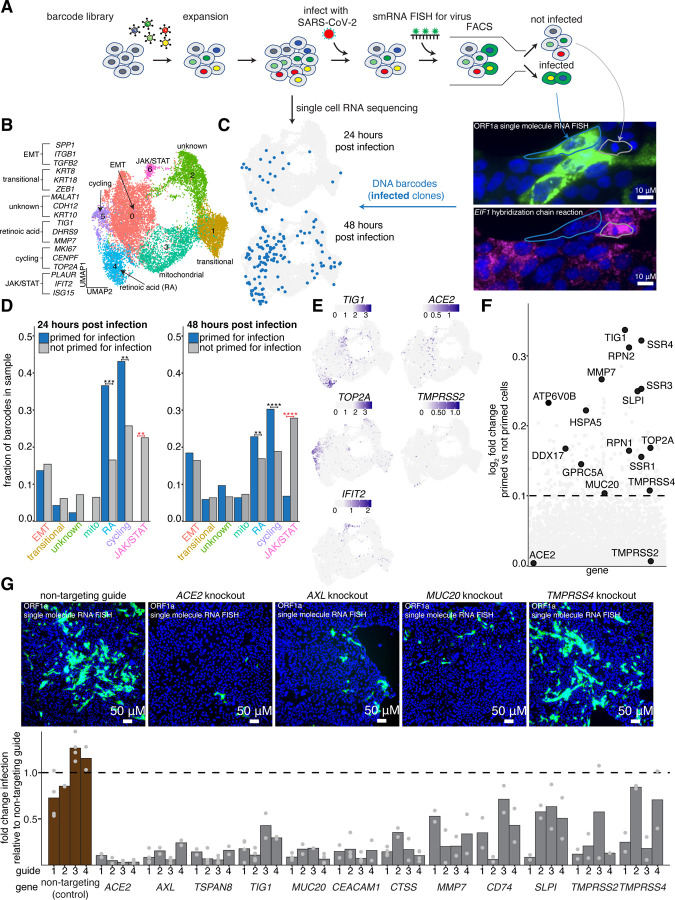
Figure 1: Single cell clone tracing reveals a distinct host transcriptional state that is highly susceptible to infection with SARS-CoV-2.
A. Schematic of Rewind approach for retrospectively identifying transcriptional states of single Calu-3 cells that are highly susceptible to infection. We retrovirally transduced 100,000 Calu-3 cells at an MOI of ~0.1. After 7 days (~3 population doublings), we split clones into two arms, performing 10x single cell RNA sequencing on one arm and infecting the other arm with SARS-CoV-2. At both 24 hours and 48 hours post infection, the infected arm was fixed and FACS sorted on viral single molecule RNA FISH signal (FISH probes targeting ORF1a within the viral genome, see methods). Clones with infected and not infected barcodes were then annotated in the matched pre-infection snapshot single cell RNA sequencing data.
B. UMAP plot showing transcriptional clusters in starting Calu-3 population. Cluster labels were assigned based on expression of marker genes within each cluster.
C. Location in UMAP space of barcodes of cells primed for infection collected at each time point (n=29 clones at 24 hours post infection, n = 132 clones at 48 hours post infection).
D. The fraction of primed barcodes found in each cluster for each time point collected. To correct for the different number of cells within each cluster, the fractions were normalized to the number of total recovered barcodes within each cluster. Significance was determined by comparing the actual barcode enrichment of primed and not primed cells within each cluster to a randomly sampled distribution of the total recovered barcodes (n=100 simulations, see methods for details). One star represents a p-value < 0.05. Two stars represent a p-value < 0.01. Three stars represent a p-value < 0.001. Four stars represent a p-value < 0.0001.
E. Normalized expression of select marker genes from each cluster that is enriched for primed barcodes or enriched for not primed barcodes.
F. Direct comparison of gene expression profiles of cells primed for infection compared to those that were not.
G. To validate that our identified markers promote SARS-CoV-2 infection, we used CRISPR-Cas9 to knockout a subset of genes that were found to be enriched in cells primed for infection. Briefly, Calu-3 were transduced with a guide construct containing both a sgRNA against a target gene and the Cas9 transgene. For each gene, we tested four independent guides. After transduction, cells were put under puromycin selection for 8 days, then infected with SARS-CoV-2. 48 hours post infection, cells were fixed and analyzed for viral single molecule RNA FISH signal via microscopy. All data is normalized to non-targeting control guides against the AAVS1 locus. Bars shown are the average of two independent biological replicates, except for certain guides targeting the non-targeting control, ACE2, AXL, CEACAM1, MUC20, TIG1, and TSPAN8 for which the bars represent the average of four independent biological replicates.

