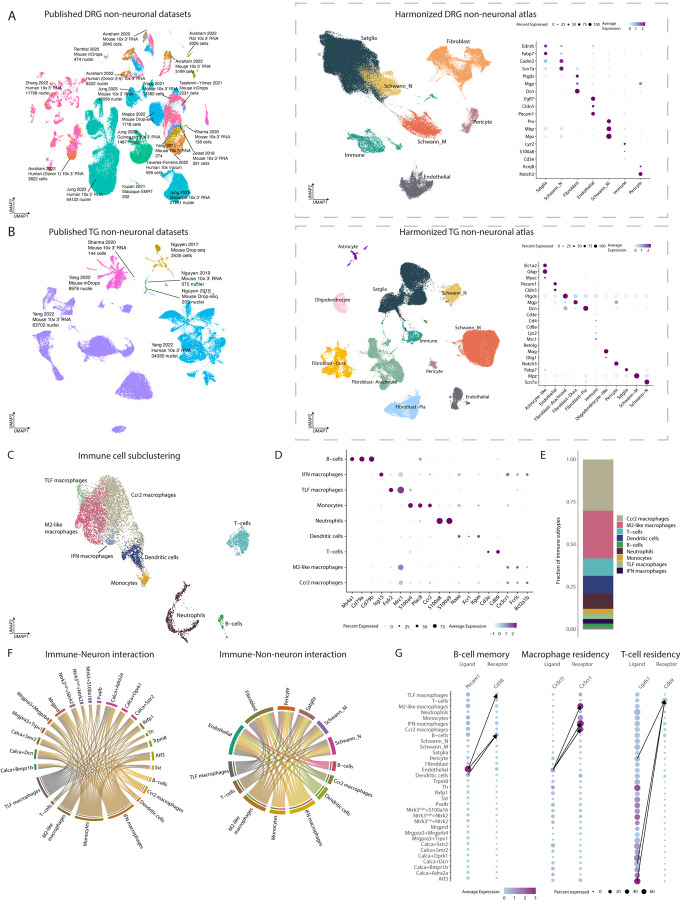
Figure 2: Integration of DRG or TG sc/snRNA-seq studies into harmonized non-neuronal atlases.
A. Integration of DRG non-neuronal sc/snRNA-seq datasets. Left: Co-clustering of the 14 sc/snRNA-seq studies used in the harmonized neuronal DRG atlas. Each study’s citation, sequencing technology, species, and number of cells/nuclei sequenced are listed. Cells/nuclei are colored by study. Middle: UMAP projection of harmonized DRG non-neuronal atlas (187,383 cells/nuclei). Cells/nuclei are colored by their final cell type annotations in the harmonized atlas. Right: Dot plot of cell-type-specific marker gene expression. Dot size indicates the fraction of cells/nuclei expressing each gene and color indicates average log-normalized scaled expression of each gene.
B. Integration of TG non-neuronal sc/snRNA-seq datasets. Left: Co-clustering of the 3 sc/snRNA-seq studies used in the harmonized non-neuronal TG atlas. Each study’s citation, sequencing technology, species, and number of cells/nuclei sequenced are listed. Cells/nuclei are colored by study. Middle: UMAP projection of harmonized TG non-neuronal atlas (88,155 cells/nuclei). Cells/nuclei are colored by their final cell type annotations in the harmonized atlas. Right: Dot plot of cell-type-specific marker gene expression. Dot size indicates the fraction of cells/nuclei expressing each gene and color indicates average log-normalized scaled expression of each gene.
C. Nine trascriptomically distinct immune cell types in DRG. UMAP projection of DRG immune cells/nuclei (n = 8,178 cells/nuclei).
D. Marker genes used to annotate nine immune subtypes. Dot plot of marker genes used to assign clusters to cell types. Dot size indicates the fraction of cells/nuclei expressing each gene and color indicates average log-normalized scaled expression of each gene.
E. Proportions of immune subtypes. Fractions displayed represent the number of cells/nuclei for a given immune cell type out of the total number of immune cells.
F. Ligand-receptor interactions between immune cells and DRG neurons and non-neurons. Predicted interactions bewteen ligands expressed by immune cells and their receptor pairs in DRG neurons (left) and non-neurons (right) (aggregated rank <0.005, see Methods). Color represents cell type. Arrow widths are proportional to the number of interactions between cell types.
G. Ligand-receptor interactions that may contribute to immune cell residency or memory. Dot plot of ligand or receptor expression in DRG cell types. Dot size indicates the fraction of cells/nuclei expressing the ligand or receptor and color indicates average log-normalized gene expression. Arrows connect the cell-cell interactions that have the three highest ligand-receptor scores (see Methods).

