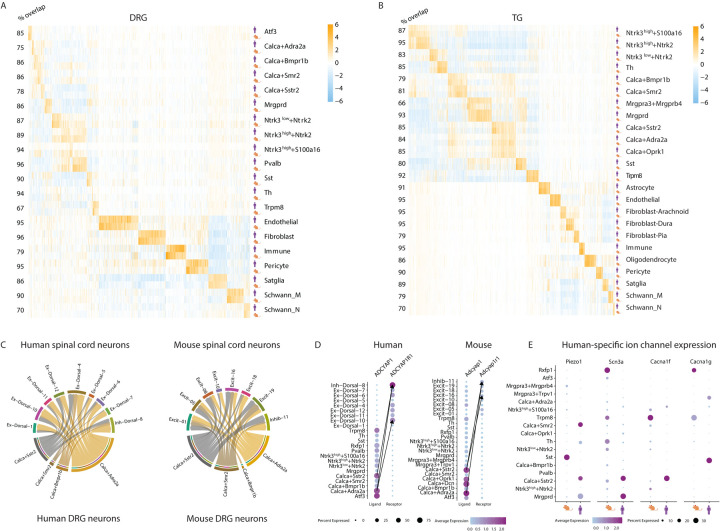
Figure 4: Cell type-specific gene expression patterns among human and mice.
A-B. Overlap of cell-type-specific gene expression between mouse and human cell types. Displayed are the log2FC values of cell-type-specific genes (columns) of either human or mouse (log2FC>0.5, adjusted p.value < 0.05) when comparing expression in one cell type compared to all other DRG cell types of the same species. Numbers to the left of rows (% overlap) represent the percent of human cell-type-specific genes that overlap with mouse cell-type-specific genes. Cell types with fewer than 20 human nuclei were not displayed.
C. Ligand-receptor interactions between DRG Calca+ neurons and spinal cord dorsal horn neurons. Predicted interactions between ligands expressed by human and mouse DRG neurons and their receptor expressed by dorsal horn neurons (aggregated rank <0.005, see Methods). Arrow widths are proportional to the number of interactions between cell types.
D. Similar cell types mediate the Adcyap1 and Adcyap1r1 interaction in human and mouse. Dot plot of ligand expression in human and mouse DRG neurons or receptor expression in spinal cord neurons. Dot size indicates the fraction of cells/nuclei in each cell type expressing the ligand or receptor and color indicates average log-normalized gene expression. Arrows connect the cell-cell interactions with the three highest ligand-receptor scores (see Methods).
E. Species-specific expression of ion channels. Dot plot displays expression of Piezo1, Scn3a, Cacna1f, Cacna1g in human and mouse DRG neuronal subtypes. Dot size indicates the fraction of cells/nuclei expressing each gene and color indicates average log-normalized expression.

