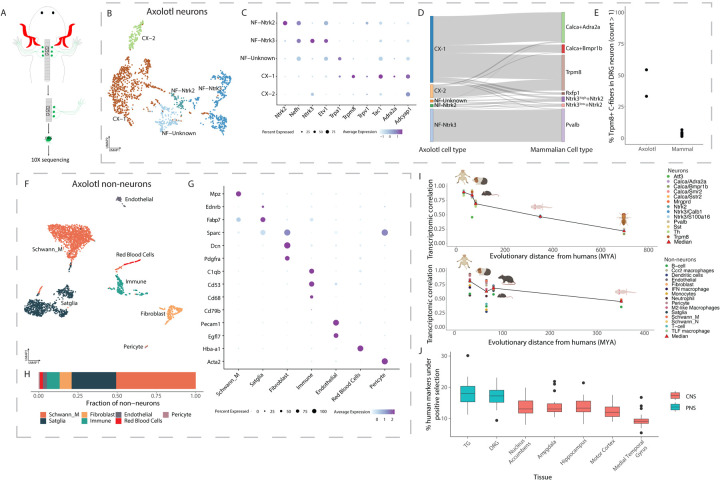
Figure 5: Transcriptomic similarity between axolotl and mammalian DRG cell types.
A. Axolotl DRG collection schema for scRNA-seq. Cervical DRGs (C3, C4 and C5) were collected (2 animals; total of 6 DRGs/animal), freshly dissociated and transcriptomically profiled by scRNA-seq.
B. Axolotl DRG neuronal subtypes: UMAP plot of 1,817 neurons from the axolotl DRG that form 5 transcriptomically distinct subtypes. A-fiber subtypes are denoted using “NF” and C-fiber subtypes are denoted using “CX”. Cells are colored by cell type.
C. Expression of marker genes used to annotate axolotl neuronal cell types. Dot plot of marker gene expression in axolotl DRG neurons. Dot size indicates the fraction of cells expressing each gene and color indicates average log-normalized expression.
D. Transcriptional similarity between axolotl and mammalian DRG neurons. Sankey plot displays the annotation of each axolotl DRG cell after anchoring to the DRG reference atlas. Only cells with anchoring scores greater than 0.5 are diplayed.
E. More axolotl C-fibers express Trpm8 compared to mammalian C-fibers. Fractions display the number of C-fibers that express Trpm8 over the total number of C-fibers in axolotols or the DRG neuronal reference atlas.
F. Axolotl DRG non-neuronal subtypes. UMAP plot of 3,031 non-neuronal cells from the axolotl DRG that form 7 transcriptomically distinct subtypes. Cells are colored by cell type.
G. Expression of marker genes used to annotate axolotl non-neuronal cell types. Dot plot of marker gene expression in axolotl DRG non-neurons. Dot size indicates the fraction of cells expressing each gene and color indicates average log-normalized expression.
H. Cell type proportions of axolotol non-neurons. Proportions displayed are a ratio of the number of axolotl non-neuronal DRG cells for a given cell type to the total number of non-neuronal cells.
I. Transcriptomic correlation with DRG cell types decreases over evolutionary distance. Plot displays for each species, the correlation between the average expression (log normalized counts) of each gene in each cell type to the average expression (log normalized counts) of each gene in the corresponding human cell type (y-axis), plotted against the evolutionary distance from humans (millions of years ago [MYA]; x-axis). Red triangles represent the median correlation for each species across all cell types. For display purposes, cynomolugus macaque and rhesus macaque were grouped together as well as mouse and rat.
J. Positive selection of cell-type-specific gene expression in PNS and CNS. Boxplots represent the number of human marker genes (log2FC>0.5, adjusted p.value < 0.05 relative to other nuclei in the same species) per cell type that are evolving under positive selection (see Methods). PNS = peripheral nervous system; CNS = Central nervous system.

