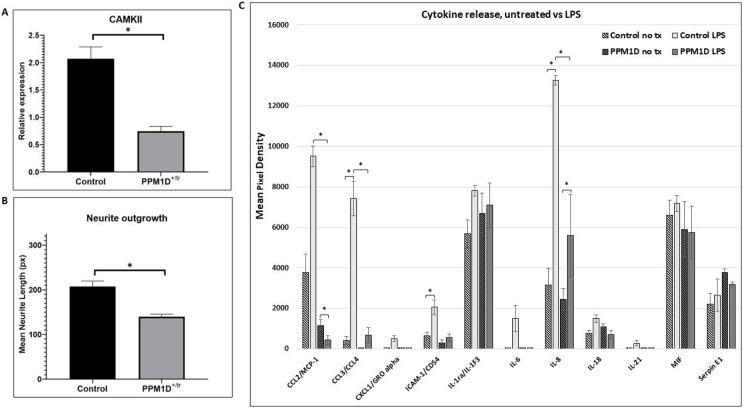
Figure 5. CaMKII, Neurite Outgrowth, Cytokine Release.
A. CaMKII phosphorylation was analyzed by quantifying Western blot signals for CaMKII, phospho-CaMKII, and cyclophilin as a loading control. The graph in 5A is a plot of the ratio of the normalized phospho-CaMKII signal (relative to cyclophilin) divided by the normalized CaMKII signal. A total of 4 control and 5 PPM1D+/tr neuronal samples were analyzed. The graph is the mean for the two groups, +/− SEM. The decrease in CaMKII phosphorylation was highly significant (p=0.0005, Student’s t-test, two-tailed). B. Neurite outgrowth was measured in day 21 glutamatergic neurons as described in the methods section. Tracings from two control and two PPM1D+/tr day 21 glutamatergic neurons were obtained, blind to genotype, for a total of 400 and 229 neurons analyzed, respectively. The difference between the two was highly significant (mean +/− SEM, 8.9E-07, Student’s t-test, two-tailed). C. Cytokine release was assayed using the Proteome Profiler Array Human Cytokine Array, as described in the methods. A total of 4 control and 3 PPM1D+/tr microglia samples were analyzed (the same samples that were analyzed in the proteomics and phosphoproteomics analyses plus an additional control that was not analyzed by proteomics. Culture supernatants were harvested after 24 hours of LPS treatment. Untreated (no tx) cells from the same differentiation were harvested simultaneously. The data are the means of 4 vs 3, with each spot on the array measured in duplicate. A Student’s t-test was used to calculate statistical significance. Those at p < 0.05 are indicated by asterisks: CCL2, untreated control LPS vs PPM1D+/tr LPS (p=0.01); untreated PPM1D+/tr vs PPM1D+/tr LPS (p=0.0009) (note CCL2 control vs control LPS had a p-value of 0.065); CCL3/CCL4, untreated control vs control LPS (p=0.02); CCL3/CCL4, control LPS vs PPM1D+/tr LPS (p=0.02); ICAM-1 untreated control vs control LPS (p=0.05); IL-8, untreated control vs control LPS (p=0.02), control LPS vs PPM1D+/tr LPS (p=0.05);

