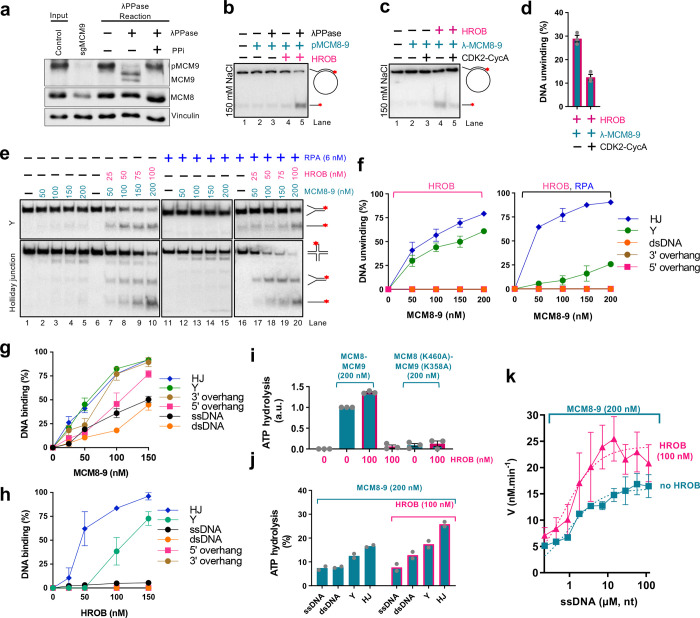
Fig. 2. MCM8–9 with HROB unwinds branched DNA structures.
a. Endogenous MCM9 is phosphorylated. Lysates from HEK293T control cells (input) were treated with lambda phosphatase (λPPase) in the absence or presence of phosphatase inhibitors (PPi) and resolved by SDS-PAGE supplemented with Phos-Bind. Immunoblotting of MCM9 and MCM8 is presented along with a loading control, vinculin. Specificity of the MCM9 band is demonstrated by the loss of signal in lysates from cells stably transduced with LentiCRISPRv2-Puro sgMCM9. Shown is a representative of two independent experiments.
b. DNA unwinding by phosphorylated human pMCM8–9 (100 nM) with or without lambda phosphatase (λPPase) treatment, with or without HROB (30 nM) using M13-based circular DNA substrate with 150 mM NaCl. The red asterisk indicates the position of the radioactive label. Shown is a representative experiment.
c. DNA unwinding by non-phosphorylated human MCM8–9 (100 nM), treated or not with CDK2-CycA, with or without HROB (30 nM) at 150 mM NaCl using M13-based circular DNA substrate with 150 mM NaCl. The red asterisk indicates the position of the radioactive label. Shown is a representative experiment.
d. Quantification of assays such as shown in panel c. Error bars, SEM; n = 3.
e. DNA unwinding by MCM8–9 without or with HROB and RPA, as indicated, with Y and Holliday junction (HJ) DNA substrates with 1 mM ATP, 5 mM magnesium acetate and 15 mM NaCl. Representative assays are shown.
f. Quantification of helicase assays such as shown in panel e and Extended Data Fig. 2i. Error bars, SEM; n = 3.
g. Quantification of DNA binding assays with MCM8–9 such as shown in Extended Data Fig. 2j. Error bars, SEM; n = 3.
h. Quantification of DNA binding assays with HROB such as shown in Extended Data Fig. 2j. Error bars, SEM; n = 3.
i. Quantification of ATP hydrolysis (expressed as arbitrary units, a.u., normalized to wild type MCM8–9 alone as 1) by 200 nM of wild type MCM8–9 and ATP-binding deficient mutant MCM8 (K460A)-MCM9 (K358A) with or without HROB. 7.2 μM (in nucleotides) M13-based circular ssDNA substrate was used as a co-factor. Error bars, SEM; n = 3.
j. ATP hydrolysis (expressed in % of total ATP hydrolysedby MCM8–9 with and without 100 nM HROB in the presence of various oligonucleotide based DNA substrates (7.2 μM, in nucleotides) and RPA (0.58 μM). Bars show range; n = 2.
k. Relationship between ATP hydrolysis by MCM8–9 (200 nM) and the concentration of DNA (μM, in nucleotides) without and with HROB (100 nM). V is the rate of ATP hydrolysis. Error bars, SEM; n = 4.

