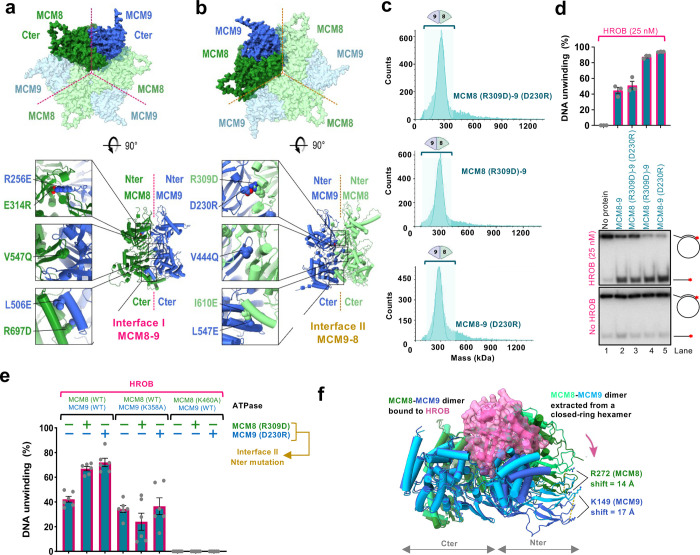
Fig. 6. MCM8–9 rings assemble from heterodimers via two distinct interfaces.
a. AlphaFold2 model showing a C-terminal view of the MCM8–9 hexamer (top). Interface I is indicated with a purple dotted line. Bottom part, mutations disrupting interface I were designed in the N-terminal, central, and C-terminal part of the interface.
b. AlphaFold2 model showing a C-terminal view of the MCM8–9 hexamer (top). Interface II is indicated with an orange dotted line. Bottom part, mutations disrupting interface II were designed in the N-terminal, central, and C-terminal part of the interface.
c. Molecular weight distributions of human MCM8–9 variants with disrupted N-terminal part of interface II measured using mass photometry. Compare with wild type MCM8–9 in Fig. 4h.
d. DNA unwinding by human MCM8–9 variants with disrupted N-terminal part of interface II (50 nM), with HROB (25 nM) using circular M13-based ssDNA at 25 mM NaCl. The red asterisk indicates the position of the radioactive label. Top, quantification; error bars, SEM; n = 3; bottom, a representative experiment.
e. DNA unwinding by human MCM8–9 variants (25 nM) with disrupted N-terminal part of interface II, in combination with ATPase Walker A mutations, as indicated, in the presence of HROB (8 nM) at 25 mM NaCl. The panel shows a quantification of assays such as shown in Extended Data Fig. 6c-e; error bars, SEM; n = 6.
f. AlphaFold2 model depicting a structural change of the MCM8–9 dimer upon binding of HROB. For simplicity, only MCM8–9 dimer is shown, without HROB.

