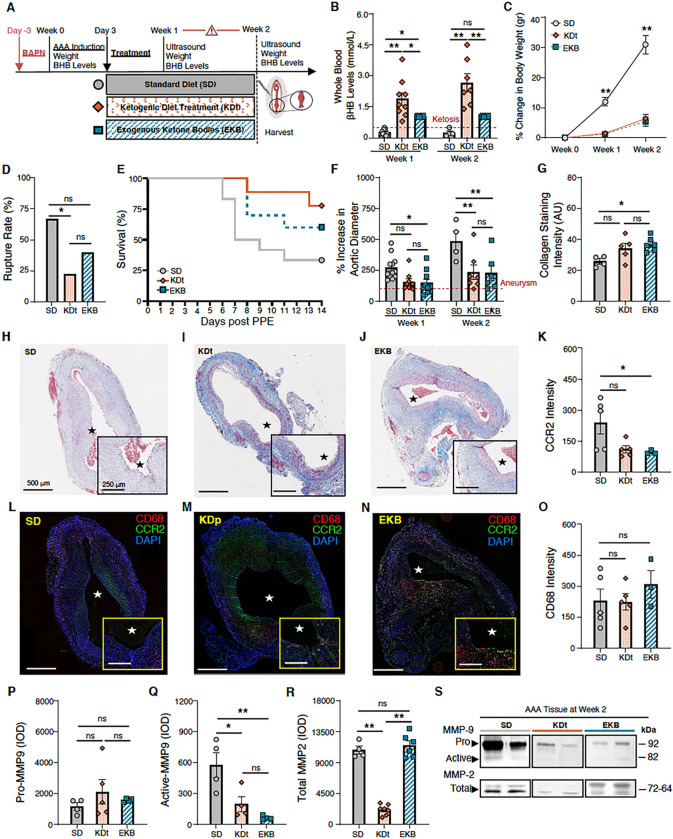
Figure 4. Impact of therapeutic ketosis on AAA risk of rupture.
(A) Animals underwent exposure to PPE to develop AAAs and were also treated with BAPN to promote AAA rupture. Following AAA induction, animals received a ketogenic ‘treatment’ via an oral diet (KDt) or exogenous supplement (EKB). (B) Ketosis (βHB whole blood levels > 0.5 mM/L) in SD, KDt, and EKB animals at week 1 (0.2±0.1, 1.8±0.9 and 1±0.02, respectively; p < 0.05) and at week 2 (0.2±0.1, 2.7±1.1, and 1±0.02 respectively; p < 0.01) analyzed using two-way ANOVA. (C) Percent body weight difference for SD, KDt, and EKB animals at week 1 (11±4, 2.5±1.4, and 2.4±1.3, respectively; p < 0.01) and at week 2 (31±6, 6±3.5, and 5±3.6, respectively; p < 0.01) analyzed using two-way ANOVA. (D) AAA rupture event rate in SD, KDt and EKB animals (p<0.05 between SD and KDt) using survival analysis. (E) Kaplan-Meier curve demonstrating survival following BAPN administration. 67% (8/12) of SD animals, 22% (2/9) of KDt animals (p=0.03), and 40% (4/10) of EKB animals (p = ns) developed AAA rupture by week 2. (F) Percent aortic diameter at week 1 in SD vs KDt animals (270±94 and 155±73; p = 0.06), and SD vs EKB animals (148±94; p = 0.04). At week 2, in SD vs KDt animals (485±153 and 234±151; p < 0.01), and SD vs EKB animals (227±147; p < 0.01 analyzed using two-way ANOVA. (G-J) Trichrome staining of AAA tissue at 5x and 10x magnifications to demonstrate collagen deposition in SD vs KDt animals (26±3 and 34±8; p = ns), and SD vs EKB animals (37±5; p = 0.02) analyzed using one-way ANOVA. (K) CCR2 ELISA content in AAA tissue of SD vs KDt animals (5.7±4 and 4.6±3; p = ns), and SD vs EKB animals (4.7±3; p = ns). (L-N) Immunofluorescent staining of AAA tissue at 5x and 10x magnifications to demonstrate CD68, CCR2, and DAPI positive cells. (O) Immunofluoresecent intensity of CD68 was analyzed using one-way ANOVA between SD, KDt, and EKB groups. (P) Pro MMP9 levels for SD vs KDt animals (1.2±0.5 ×10³ and 2.1±1.7 ×10³; p = ns), and SD vs EKB animals (1.6±0.12 ×10³; p = ns). (Q) Active MMP9 levels for SD vs KDt (5.8±2.4 ×10² and 2±1.4 ×10²; p = 0.02), and SD vs EKB animals (0.7±0.2 ×10²; p = 0.005). (R) Total MMP-2 levels for SD vs KDt animals (10.8±1.1 ×10³ and 2.1±0.7 ×10³; p < 0.001), and SD vs EKB animals (11.5±1.7 ×10³; p = ns). Pro and active MMP9 and total MMP2 levels were measured by integrated optical density (IOD) in AAA tissue, and analyzed using one-way ANOVA. (S) Representative separate zymogram gels of AAA tissue homogenates at week 2, demonstrating pro and active MMP-9 and total MMP-2 levels in animals fed SD, KDt, and EKB. Data presented as mean ± standard deviation. ns > 0.05, *p < 0.05, **p < 0.01, ***p < 0.001 using one-way ANOVA, or two-way ANOVA with multiple comparison.

