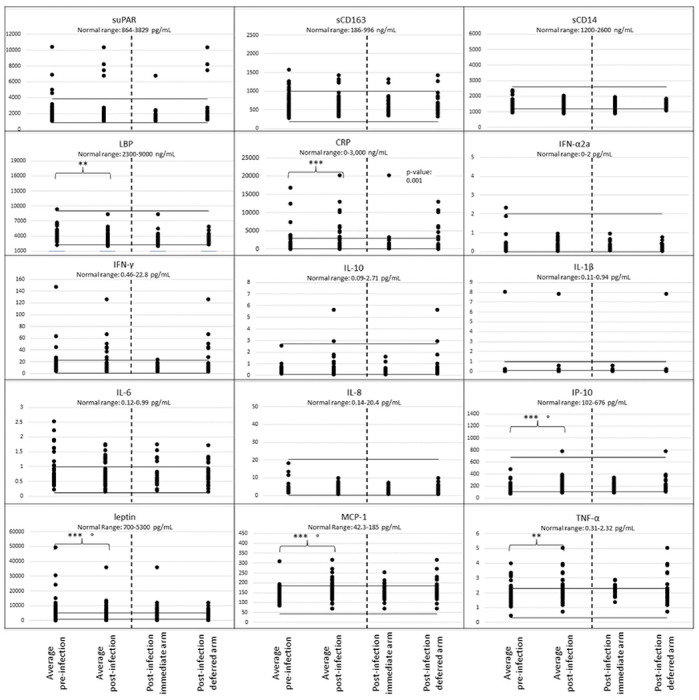
Figure 1. Plasma biomarker levels comparing pre-HIV-infection to post-infection and antiretroviral therapy-suppression by timing of ART initiation.

Each biomarker evaluated is shown in a separate panel, with normal upper and lower ranges indicated by solid horizontal lines. The mean biomarker levels are plotted for each participant’s (N=50) biomarker values from two timepoints prior to HIV infection (preacquisition) and two timepoints post-ART-suppression (>6 months and >2 years post ART suppression of plasma HIV RNA to <200 c/mL). The two post-ART-suppression values also shown for “all” participants and separately by the two “as-treated” groups by the time when ART was initiated, either immediately upon diagnosis during primary infection (N=21) or deferred for 24 weeks after HIV diagnosis (N=26) (Immediate-ART, Deferred-ART, respectively). Unadjusted p-values by a regression analysis shown (* <0.01, ** < 0.05, *** < 0.001) for significant changes in mean cytokine levels between the 47 participants prior to HIV infection versus after ART-suppression. Holm adjusted p-values <0.001 indicated by (°).
