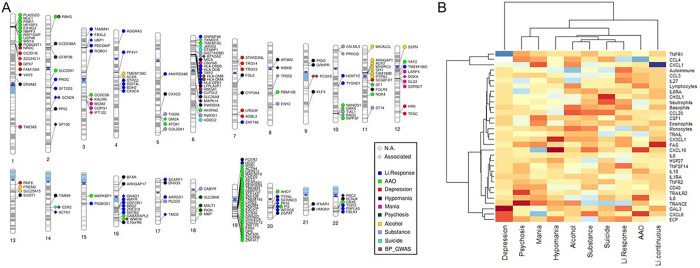
Figure 2.
A) Gene-based phenogram of eQTL annotations for the exploratory-level findings of the ImmuneSet in ConLi+Gen. Those eQTL genes that were different from the mapped gene and those that were the same are presented in circle and diamond shapes, respectively. Only protein-coding genes are shown. In addition, overlaps with BP genetic associations reported in the GWAS Catalog are presented. B) Exploratory findings for the immune-related polygenic scores calculated in ConLi+Gen. Significance of calculated PGSs for BP phenotypes in ConLi+Gen “GWAS1”. The heatmap shows the z-values obtained for each PGS-phenotype pair. Increasing color darkness alludes to increasing effect, with red and blue colors at the negativ and positive extremes, respectively.

