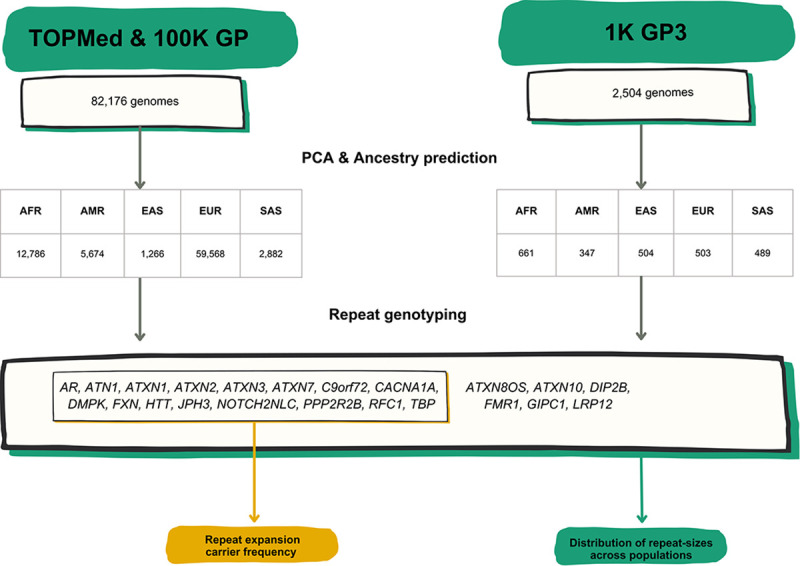
Figure 1.

A) List of RED loci included in the study including repeat-size thresholds for reduced penetrance and full mutations. B) Technical flowchart. Whole genome sequences (WGS) from the 100K GP and TOPMed datasets were first selected by excluding those associated with neurological diseases. WGS data from the 1K GP3 were also selected by having the same technical specifications (see Methods). After inferring ancestry prediction, repeat sizes for all 22 REDs were computed by using EH v3.2.2. On one hand, for 16 REDs overall carrier frequency, disease modelling, and correlation distribution of long normal alleles were computed in the 100K GP and TOPMed projects. On the other hand, the distribution of repeat sizes across different populations was analysed in the 100K GP and TOPMed combined, and in the 1K GP3 cohorts.
