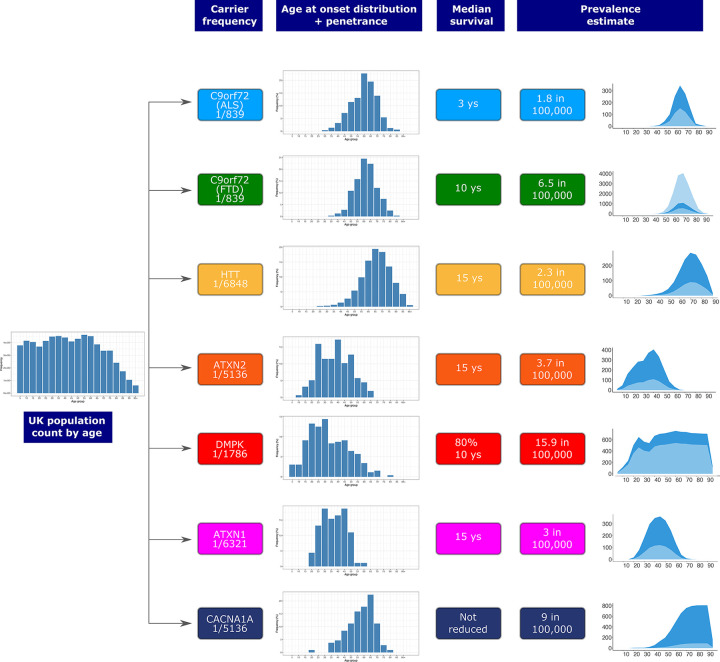
Figure 3.
Flowchart showing the modelling of disease prevalence by age for C9orf72-ALS, C9orf72-FTD, HD in 40 CAG repeat carriers, SCA2, DM1, SCA1, and SCA6. UK population count by age is multiplied by the combined disease allele frequency of each genetic defect and the age of onset distribution of each corresponding disease, and corrected for median survival. Penetrance is also taken into account for C9orf72-ALS and C9orf72-FTD. Estimated number of people affected by REDs (dark blue area) compared to the reported prevalence from the literature (light blue area). Age bins are 5 years each. For C9orf72-FTD, given the wide range of the reported disease prevalence,32,33 both lower and upper limits are plotted in light blue.

