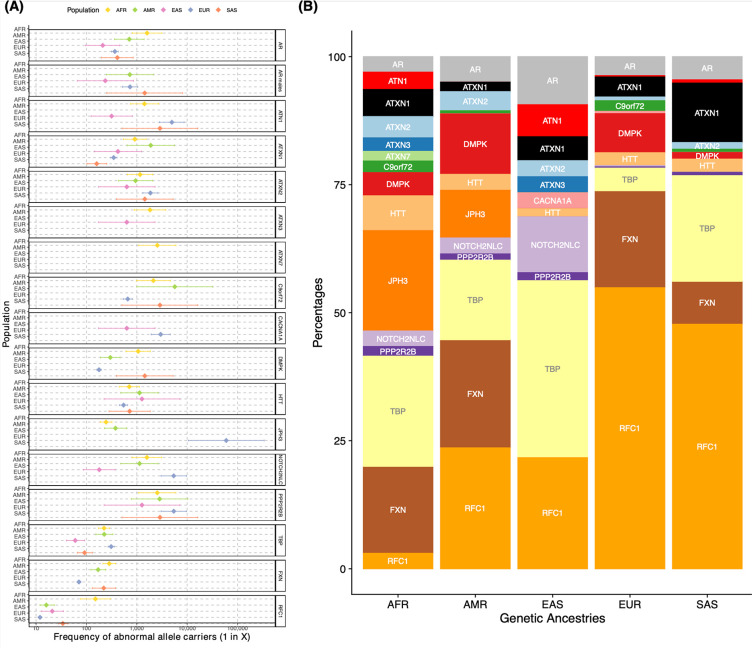
Figure 4.
Pathogenic RED frequencies in different populations (African = 12,786; American = 5,674; East Asian = 1,266; European = 59,568; South Asian = 2,882. A) Forest plot of pathogenic allele carrier frequency divided by population. Pathogenic alleles are defined as those larger than the premutation cut-off (Table1). Data are presented as squares showing the estimated pathogenic allele carrier frequency, and bars showing the 95% CI values. B) Bar chart showing the proportion of pathogenic allele carrier frequency repeats by ancestry. Both plots have been generated by combining data from 100K GP and TOPMed from a total of N = 82,176 unrelated genomes. N individuals may vary slightly between loci due to data quality and filtering, see Table S17 and Table S18).

