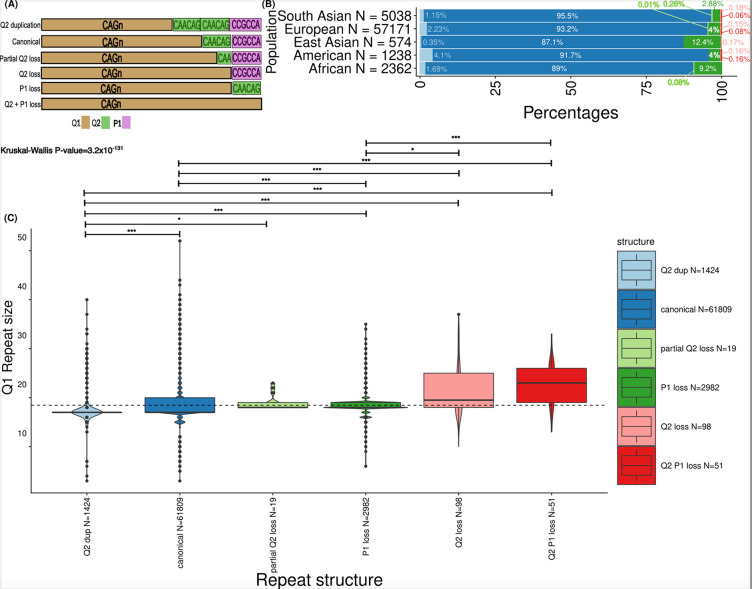
Figure 6.
HTT repeat structures show varied prevalence across genetic ancestries and are associated with CAG repeat size. A) Allele structures observed within exon 1 of HTT. The CAG repeat is denoted as “Q1” and marked in gold. The CAACAG unit is referred to as “Q2” and is marked in green. The first proline-encoding “CCGCCA” repeat element is referred to as “P1” and is marked in purple. B) The prevalence of the allele structures is plotted across the studied genetic ancestries in bar plots on the x-axis. The ancestries are defined on the y-axis. The number of alleles in each of the genetic ancestries is denoted as “N=...” at each of the y-axis ticks. C) Boxplots display the distribution of CAG repeat sizes across different repeat structures. Box plots highlight the median (horizontal lines in the centre of each boxplot), interquartile range (bounds) and black dots show values outside 1.5 times the interquartile range. The repeat structures are separated on the x-axis and the repeat size is shown on the y-axis. The number of alleles with different repeat structures is denoted as “N=...” on the x-axis. A linear model was used to compare the repeat size distribution of the canonical alleles versus that of all atypical structures. Kruskal-Wallis tests with Dunn’s correction for multiple comparisons p value; p-values resulting from pairwise tests are displayed above each structure (*** < 0.001; * < 0.05). Q2 versus canonical (p-value = 6.4×10⁻³²), Q2 versus partialQ2 loss (p-value = 3.5×10⁻²), Q2 duplication versus P1 loss (p-value = 5.9×10−98), Q2 duplication versus Q2 loss (p-value = 8.5×10⁻¹⁶); Q2 duplication versus Q2-P1 loss (p-value = 6.2×10⁻²⁰), canonical versus P1 loss (p-value = 2.4×10−80), canonical versus Q2 loss (p-value = 2.8×10⁻⁸), canonical versus Q2-P1 loss (p value = 1.2×10¹²), P1 loss versus Q2 loss (p-value = 2.8×10⁻²), P1 loss versus vs Q2-P1 loss ( p-value = 5.6×10⁻⁶)

