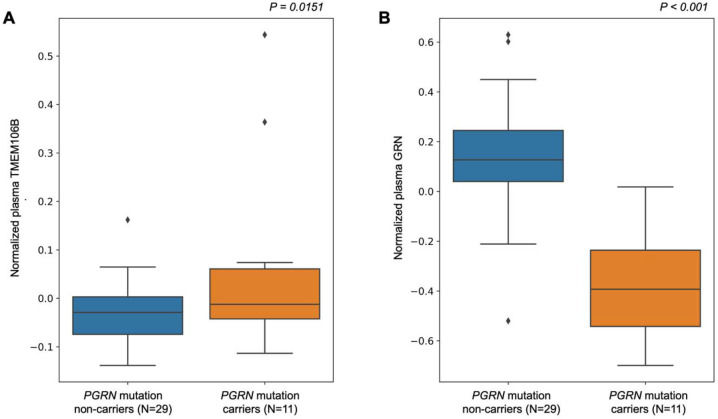
Figure 3. Differential abundance analysis of PGRN mutation carriers versus non-carriers on plasma TMEM106B and GRN protein levels.
A) Boxplot of the normalized plasma protein TMEM106B levels between PGRN mutation carriers and non-carriers. Mutation carriers have significantly higher TMEM106B levels (p = 0.0151).
B) Boxplot of normalized plasma protein GRN levels between PGRN mutation carriers and non-carriers. Mutation carriers have significantly lower GRN levels (p = 2.89×10⁻⁸), Analyses were adjusted for age, sex, and proteomic principal components 1 and 2.

