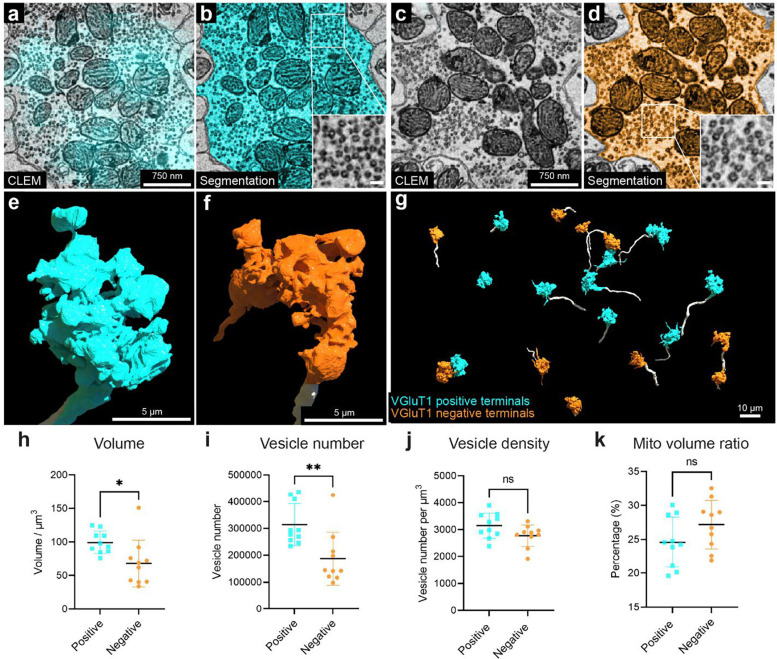
Figure 7. 3D reconstruction and analysis of VGluT1 positive and negative mossy fiber terminals based on labeling with the VGluT1-specific scFv probe.
a, 2D CLEM image showing the fluorescence signals (cyan) of the VGluT1-specific scFv probe overlaps with a mossy fiber terminal. b, EM image showing the 2D segmentation (cyan) of the mossy fiber terminal labeled in a. The enlarged inset shows the morphology of synaptic vesicles in this terminal. c, 2D CLEM image showing a mossy fiber terminal lacking VGluT1 fluorescence signal. d, EM image showing the 2D segmentation (orange) of the mossy fiber terminal labeled in c. The enlarged inset shows the morphology of synaptic vesicles in this terminal. e, 3D reconstruction of the VGLUT1 positive mossy fiber terminal (cyan) in b. The axon leading to the terminal arises from the bottom of the panel. f, 3D reconstruction of the VGluT1 negative mossy fiber terminal (orange) in c. The axon leading to the terminal arises from the bottom of the panel. g, 3D reconstruction of ten VGluT1 positive mossy fiber terminals (cyan) and ten VGluT1 negative mossy fiber terminals (orange). The axons are labeled in white. h, volume, i, vesicle number, j, versicle density, k, mitochondria volume ratio per terminal volume were measured for each of the 10 VGluT1 positive terminals, cyan, and the 10 VGluT1 negative terminals, orange. Mean values with SD were shown on each graph. Mito, mitochondria.

