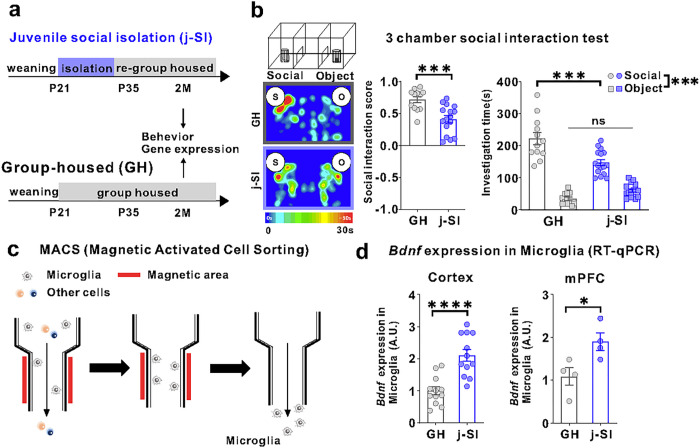
Figure 1. Juvenile social isolation reduces sociability and increases MG-Bdnf expression.
(a) Schema of the GH and juvenile social isolation (j-SI) mice time series. The experiments were started at P56. (b) Sociability j-SI mice displayed reduced sociability in the three-chamber sociability test compared with GH mice. j-SI mice had a lower social interaction score than GH mice (t(26) = 3.948, p =0.0005, unpaired two-tailed Student’s t-test, GH: n = 12, j-SI: n = 16) and spent less time near novel mice (F1,26 (interaction) = 17.16, p = 0.0003, two-way ANOVA followed by Bonferroni post hoc test, Bonferroni post hoc analysis of GH S vs. j-SI S, p < 0.0001 GH: n = 12, j-SI: n = 16). S, social; O, object. (c) Image of magnetic-activated cell sorting. (d) (Left) Bdnf expression measured using real-time quantitative polymerase chain reaction (RT-qPCR) in microglia recovered from the cortex was higher in the j-SI mice than in the GH mice (t(22) = 4.876, p < 0.0001, unpaired two-tailed Student’s t-test, GH: n = 12, j-SI: n = 12). (Right) Bdnf expression measured using RT-qPCR in microglia recovered from the mPFC was higher in j-SI than in GH mice (t(6) = 2.818, p=0.0304, unpaired two-tailed Student’s t-test, GH: n = 4 (from 16 mice), j-SI: n = 4 (from 16 mice)). The value was log-transformed with a base of 10 because of the right-skewed distribution. Each dot indicates the expression of Bdnf in microglia collected from the mPFC of four mice. *p < 0.05, ***p < 0.001, ****p < 0.0001. Data are presented as the mean ± SEM. 2M: two months of age, A.U.: arbitrary unit

