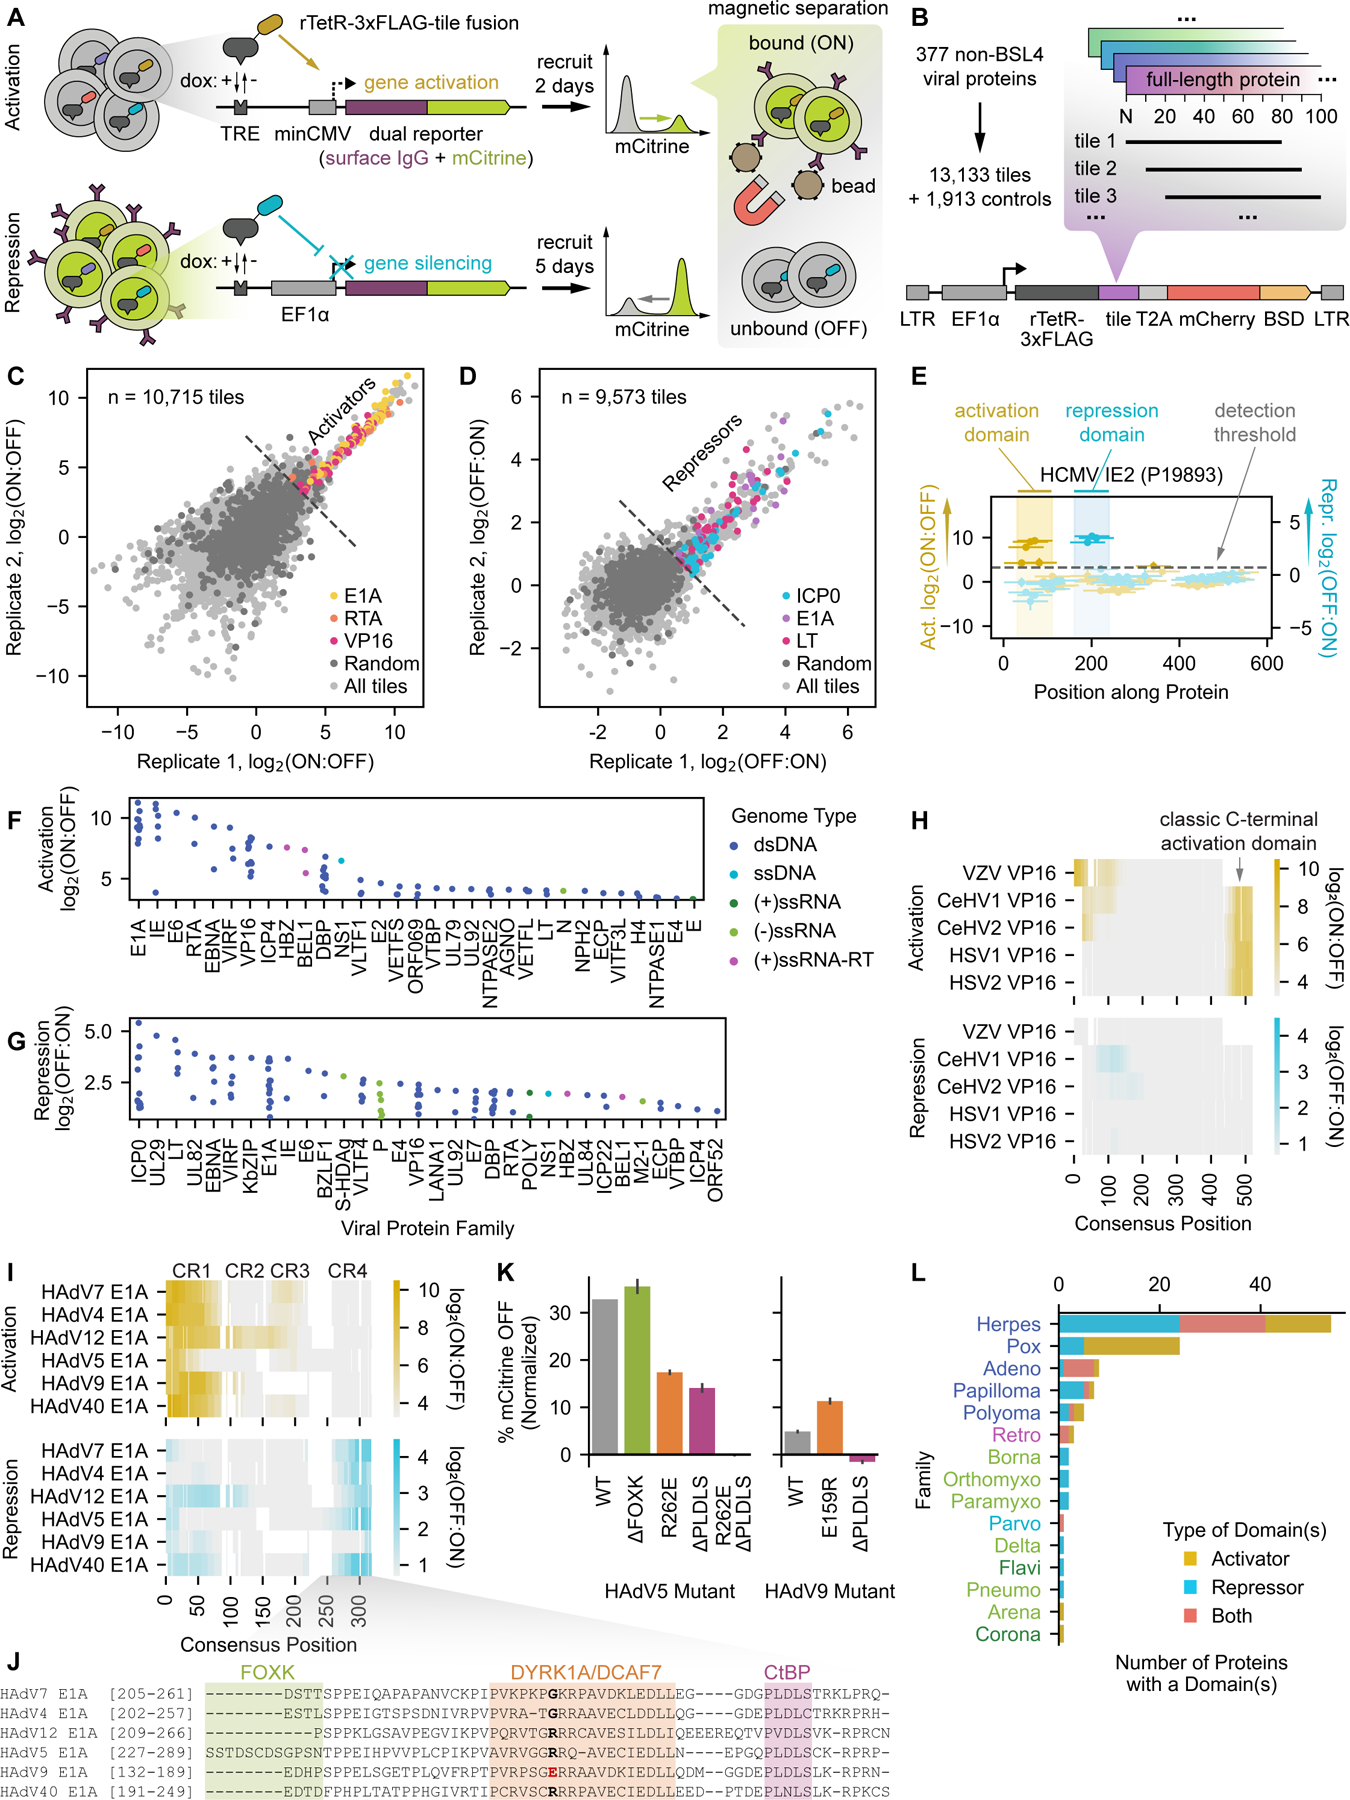
Fig. 1 |. HT-recruit recovers hundreds of protein domains with transcriptional effector activity among a set of known or putative viral transcriptional regulators.

(A) Schematic of the high-throughput recruitment (HT-recruit) approach. Library members are synthesized, cloned as fusions to the doxycycline (dox)-inducible rTetR DNA-binding domain, and delivered to cells harboring a dual reporter gene encoding both mCitrine and a surface marker that enables magnetic sorting of cells by reporter transcriptional state. Library member frequencies in the bead-bound (ON) and unbound (OFF) populations are determined by next generation sequencing to compute enrichment scores. Pooled screens are performed in cells whose reporter is under the control of a weak minimal cytomegalovirus (minCMV) promoter to measure transcriptional activation (top) or a strong EF1a promoter to measure repression (bottom). TRE = tetracycline response element (nine copies of the TetO sequence that can be bound by rTetR). (B) Composition of the viral transcriptional regulator (vTR) library, which includes 80aa-long tiles sampled every 10aa for 377 proteins with known or putative transcriptional regulatory potential. BSD = blasticidin resistance gene. (C) Reproducibility of activation enrichment scores, log2(ON:OFF), across two replicates, with hit tiles from the well-described activators E1A, RTA, and VP16 indicated. For all analyses, the detection thresholds (dashed lines in C-G) are set as two standard deviations above the mean of the random negative controls. (D) Reproducibility of repression enrichment scores, log2(OFF:ON), across two replicates, with hit tiles from the repressors E1A, ICP0, and LT indicated. (E) Calling activation and repression domains from tiling measurements, using the HCMV IE2 protein as an example. The dashed line represents the detection threshold, and higher scores above it correspond to stronger activation (yellow) or repression (blue). Vertical spans indicate the maximum strength tile within each domain. (F-G) Summary of identified activation (F) and repression (G) domains, represented by their strongest tile, stratified by viral protein family, and colored by the genome type of the virus that encodes them. ds = double-stranded, ss = single-stranded, (+) = positive-sense, (-) = negative-sense, and RT = reverse-transcribed. (H) Multiple sequence alignment (MSA) of five herpesvirus VP16 homologs, with activation log2(ON:OFF) and repression log2(OFF:ON) enrichment scores represented as yellow and blue color mappings, respectively. (I) MSA of six human adenovirus (HAdV) E1A homologs with their conserved regions (CRs) indicated. Color mappings reflect enrichment scores as in (H). (J) Zoomed alignment of CR4 showing known cofactor binding regions for HAdV5 E1A. A critical residue within the DYRK1A/DCAF7-binding region is bolded, with the HAdV9 mutant highlighted in red. (K) Quantification of the fraction of cells OFF by flow cytometry (normalized to no dox) after 5 days of recruitment of wild-type (WT) and mutant CR4 sequences from HAdV5 and HAdV9 E1A. (L) Summary of vTR proteins with at least one effector domain, stratified by viral family and colored by effector type. Viral family names are colored by genome type (see legend of F&G).
