
Fig. 3 |. Sequence analysis and systematic perturbation of herpesvirus transcriptional effector sequences.
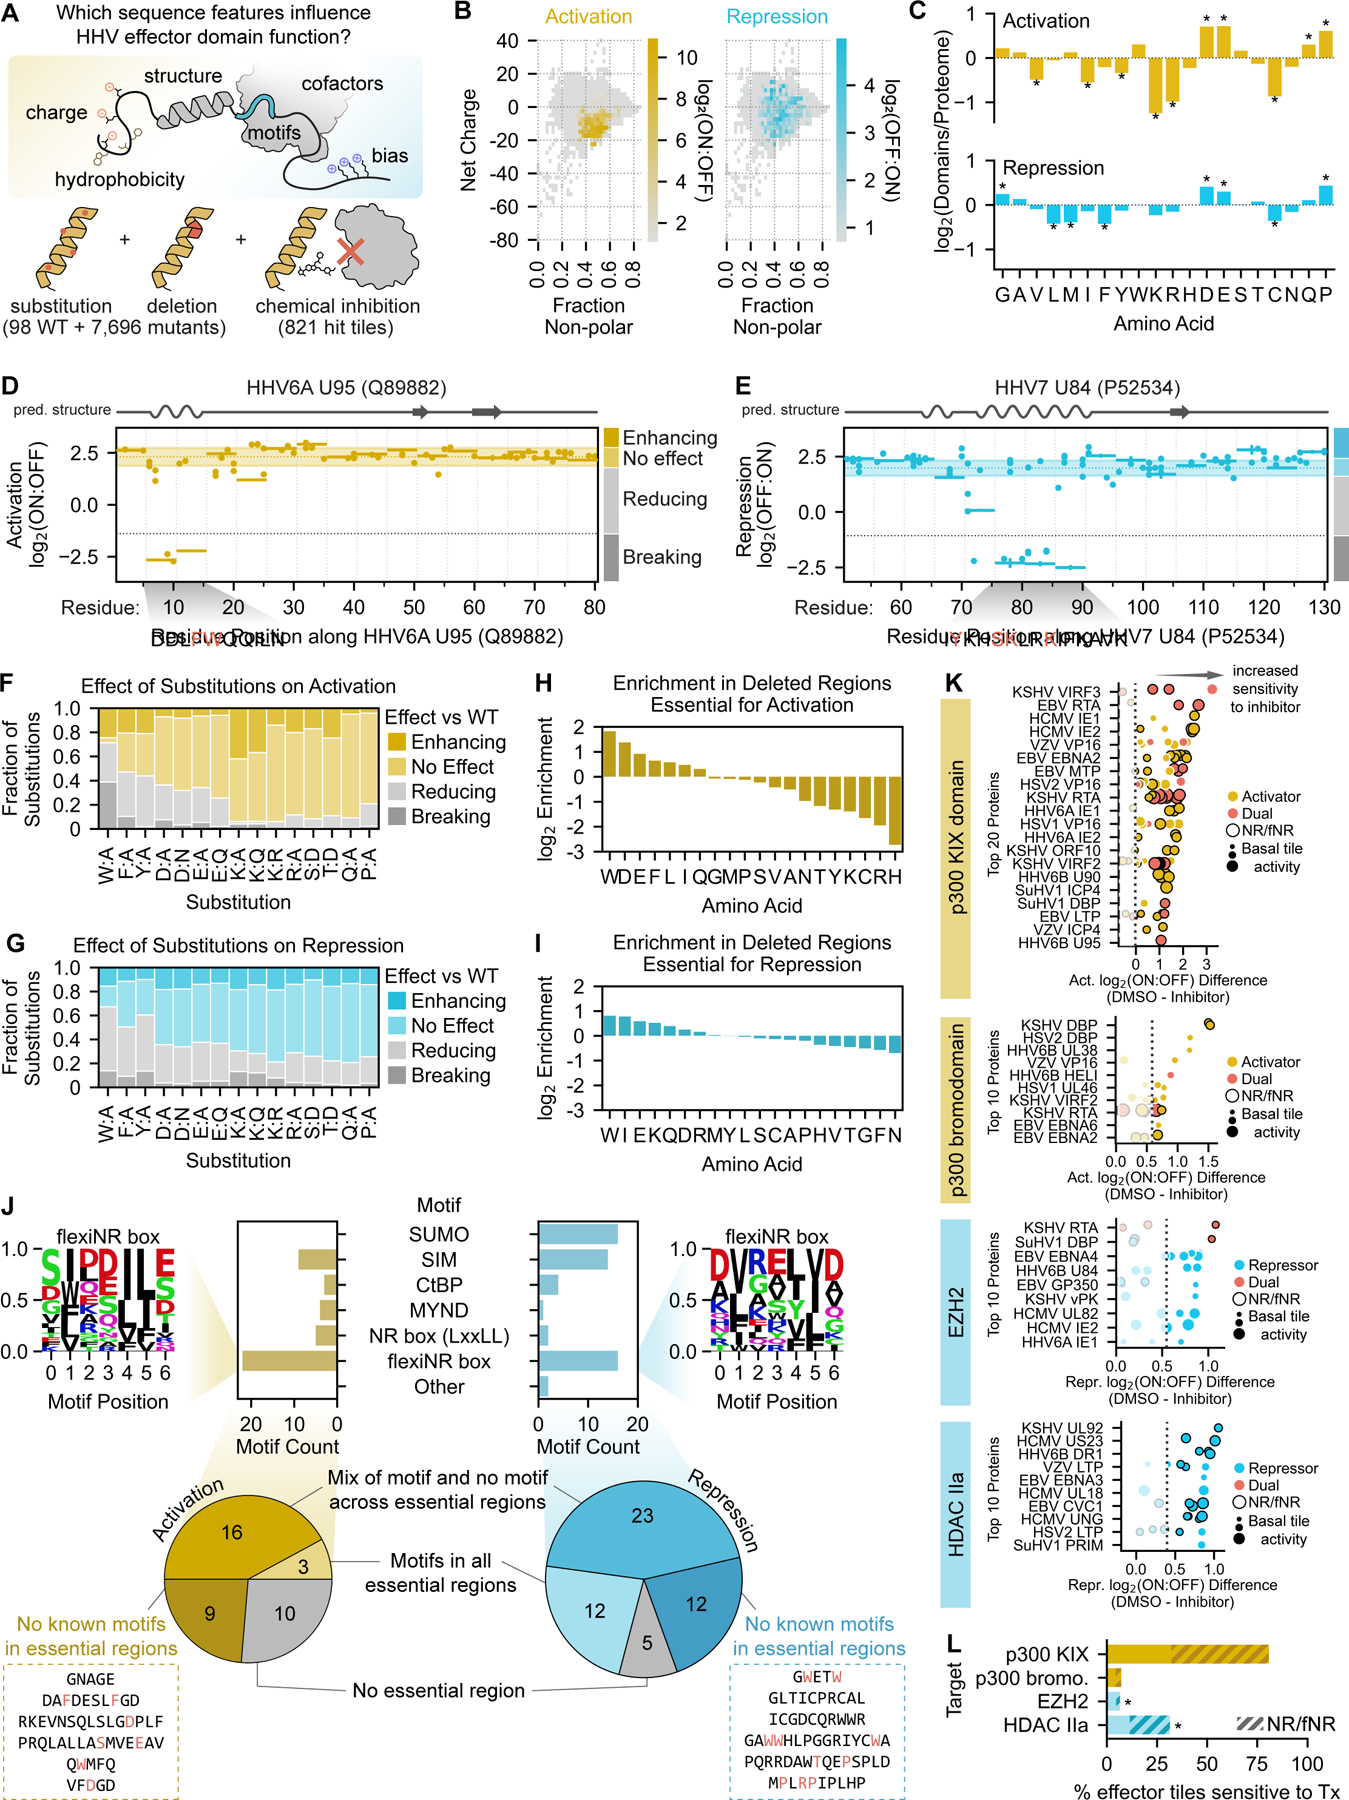
(A) Overview of the sequence features examined and the perturbations performed to connect herpesvirus (HHV) effector domain sequences to their functions. (B) Two-dimensional histograms of net charge versus the fraction of non-polar residues for all tiles in the HHV tiling screen. Bins are colored with their maximum activation (yellow, left) or repression (blue, right) screen score as indicated by the color bars. (C) Barplots of the log2-transformed ratios of amino acid frequencies in activation (top) or repression (domains) relative to their proteome frequencies. Positive values represent an enrichment in effector domains while negative values represent a depletion. Significant differences in amino acid frequencies were determined by the Welch’s T test (Bonferroni-corrected) and are indicated as stars. (D, E) Perturbation tiling plots mapping the effects of single-residue substitutions (dots) and 5aa deletions (horizontal spans) on the maximum-strength tiles from the activation domain of HHV6A U95 (D) and repression domain of HHV7 U84 (E). JPred4-predicted secondary structures are shown above the plots, with alpha helices as squiggles, beta sheets as arrows, and other (including unstructured) as a straight line. The shaded horizontal span represents the wild-type screen score mean plus/minus two times the estimated error (mean of all wild-type tiles shown as the yellow horizontal dotted line within) for U95 (D) and U84 (E). Perturbations with scores within these regions are considered to have ‘no effect’, while those above and below are considered ‘enhancing’ and ‘reducing’, respectively. The gray horizontal dotted lines represent the detection thresholds, and thus perturbations whose scores are below this threshold are considered ‘breaking’. Deleted regions below the detection threshold are deemed essential, and their sequences are displayed below the plot, with red residues indicating single-residue substitutions that abolish activity. (F-G) Effect of single-residue substitutions on activation (F) or repression (G) as measured in the perturbation screen. (H-I) Barplots of the log2-transformed ratios of amino acid frequencies in regions whose activity is essential to activation (H) or repression (I) relative to their proteome frequencies. (J) Top: counts of motifs that are enriched in essential regions. Logo of the newly proposed flexiNR box motif from all essential regions in activators (top left) or repressors (top right). Other motifs follow ELM definitions (Methods). Also shown are examples of essential sequences with no known overlapping motif (inside dashed boxes), with the residues most sensitive/critical to activity as determined by single-residue substitution in red. (K) Summary of the top 20 herpesvirus proteins with tiles sensitive to p300/CBP KIX domain inhibition with celastrol (top) or the top 10 herpesvirus proteins with tiles sensitive to p300/CBP bromodomain inhibition with SGC-CBP30 (upper middle), EZH2 inhibition with tazemetostat (lower middle), and class IIa HDAC inhibition with TMP269 (bottom). Each dot is a tile from the viral protein indicated on the y-axis and is colored based on its effector activity. Dot size indicates the strength of the tile’s transcriptional effect in the DMSO control screen, and a black outline indicates the presence of at least one NR or flexiNR box motif (NR/fNR) in the tile. The x-axis shows the difference between screen scores in the DMSO control screen versus in the screen with inhibitor, with increasing positive values indicating increased sensitivity to the inhibitor (i.e. greater impairment of activation or repression with treatment). The dashed lines in the p300/CBP inhibition screens represent the sensitivity threshold set at the mean plus two standard deviations of the repressor scores (expected to have no activity), and vice versa for the EZH2 and class IIa HDAC inhibition screens. (L) Summary of the percent of activator tiles (yellow) or repressor tiles (blue) whose activities are significantly reduced upon treatment with the inhibitors in (K). The hashed portion indicates the fraction of sensitive tiles that contain an NR box or flexiNR box motif (NR/fNR). Stars indicate significant depletion of these motifs in tiles sensitive to EZH2 inhibition (OR: 0.31, 95% CI: 0.13–0.73) or significant enrichment in tiles sensitive to class IIa HDAC inhibition (OR: 1.58, 95% CI: 1.03–2.42).