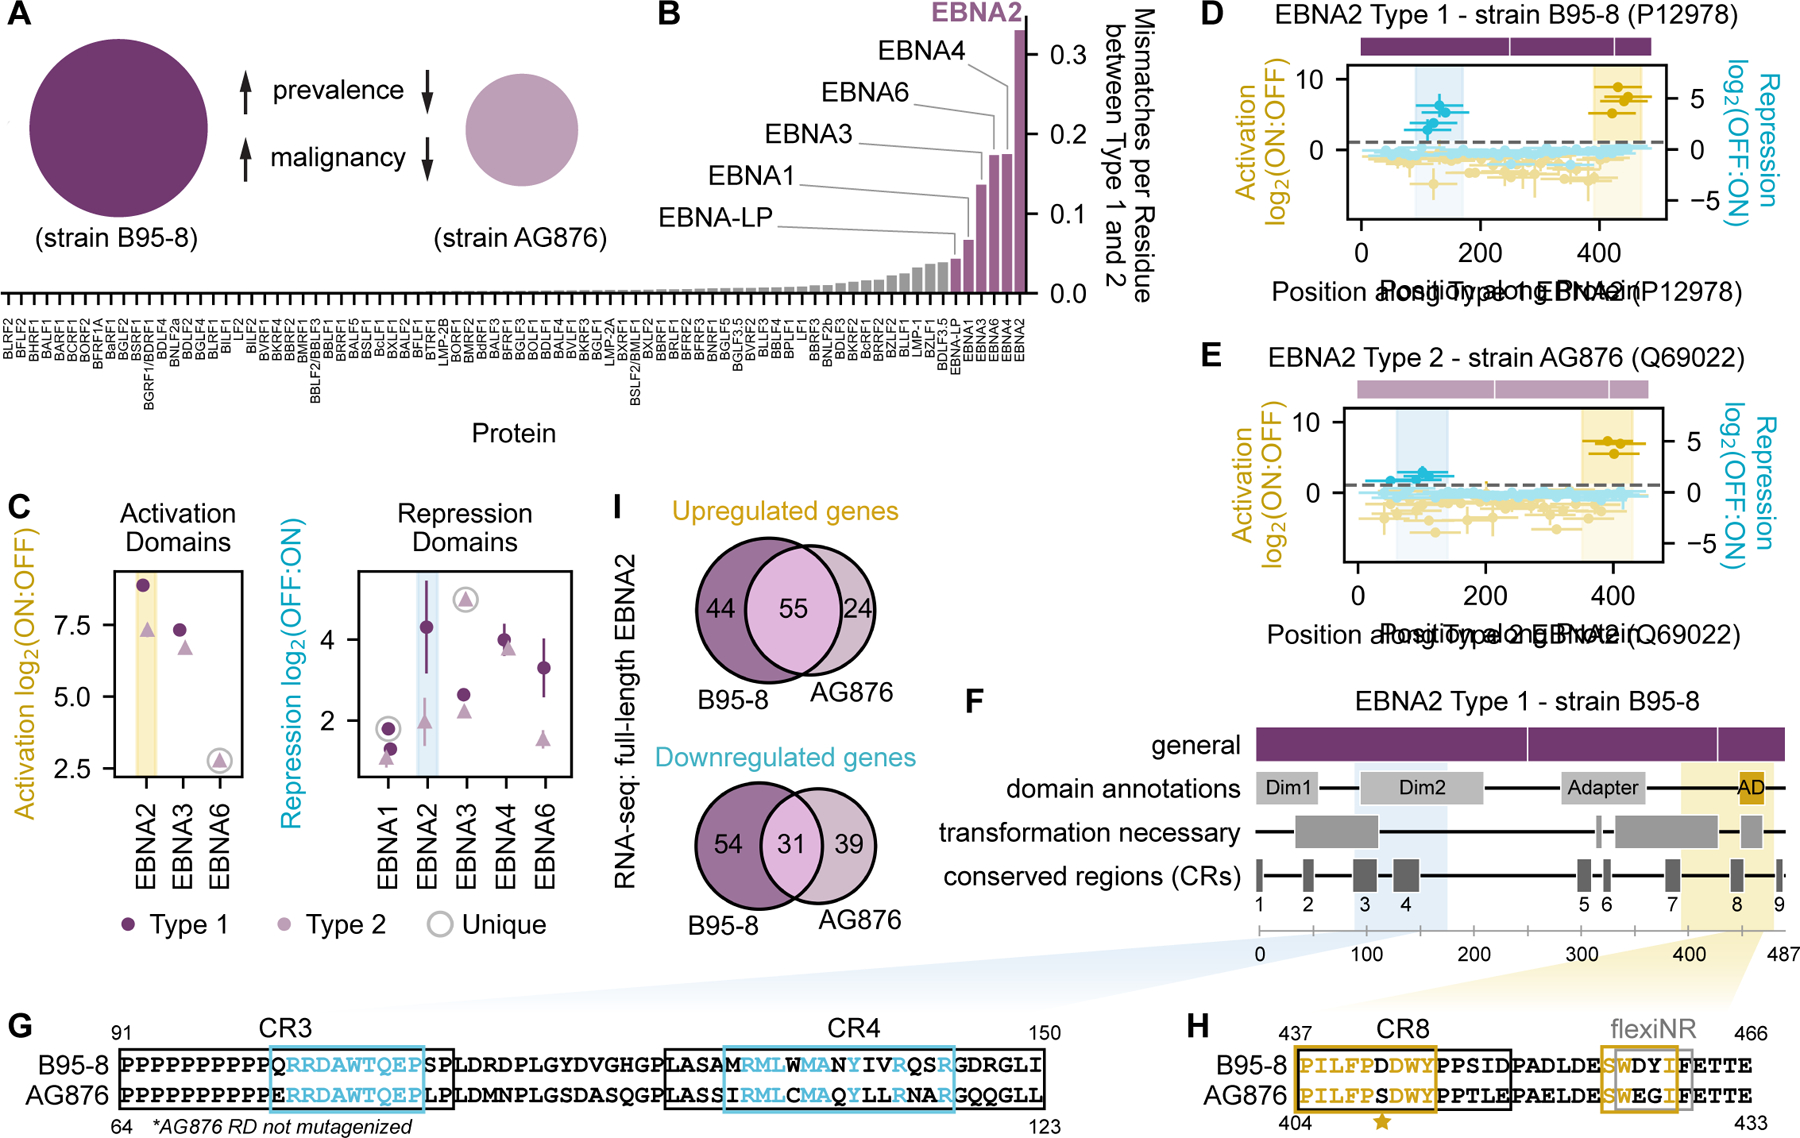
Fig. 4 |. Sequence and functional comparison of EBNA family effector domains.

(A) EBV type 1 and type 2 are associated with different clinicopathological features. (B) Sequence dissimilarity between type 1 (B95-8 strain) and type 2 (AG876 strain) homologs of each EBV protein, quantified as the number of mismatches per residue. EBNA family proteins (highlighted) exhibit the greatest sequence dissimilarity between EBV type 1 and type 2. (C) Summary of activation and repression domain strengths across type 1 (dark circles) and type 2 (light triangles) homologs of EBNA proteins. The activation and repression domains of EBNA2 are highlighted with yellow and blue spans, respectively. ‘Unique’ refers to effector domains detected in only the type 1 or type 2 homolog. (D-E) Tiling plots of type 1 (D) and type 2 (E) EBNA2, with simple schematics showing rough domain boundaries (see (F) for details). (F) Schematic of type 1 EBNA2 with relevant annotations. Colored spans indicate the maximum strength tile coordinates for repression (blue) and activation (yellow). CBF1-BD = CBF1 binding domain (for indirect association with DNA); Dim = dimerization domain; transform. ess. = essential for cellular transformation; AD = activation domain. (G-H). Pairwise alignments of EBNA2 sequences from the B95-8 (Type 1) and AG876 (Type 2) strains. Consensus essential regions as determined from deletion scanning are indicated for the repression domain in (G) with blue boxes or for the activation domain in (H) with yellow boxes, where colored letters indicate residues within these regions that are identical between strains. The repression domain (RD) of the AG876 EBNA2 homolog was not mutagenized. Star represents the S to D mutation that restores AG876 EBNA2 activity to the B95-8 level. CR = conserved region. (I) Venn diagrams showing the number of unique and shared significantly upregulated (left) and downregulated (right) genes as measured by RNA-seq in cells expressing either full-length B95-8 or AG876 EBNA2.
