
Fig. 5.
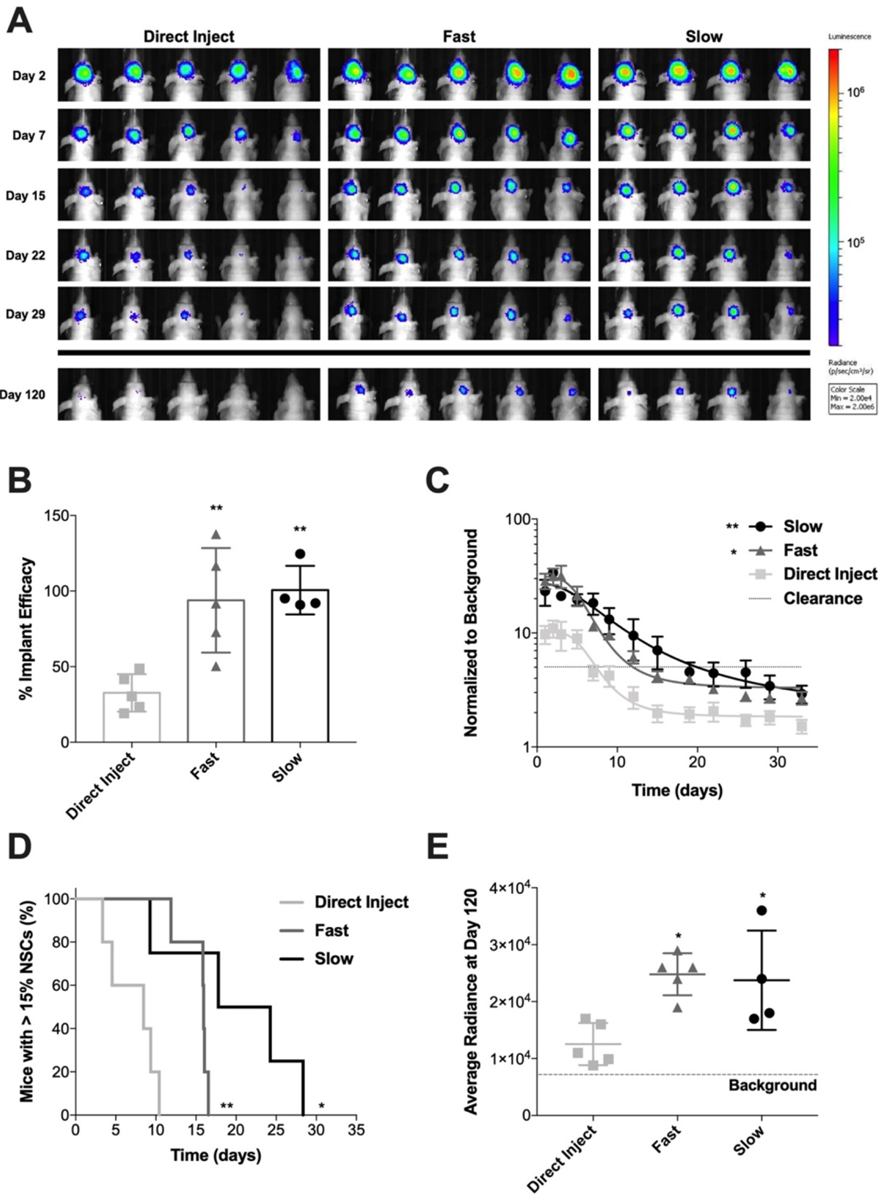
Persistence of NSC seeded on Ace-DEX gelatin scaffolds in resection cavity. (A) BLI images showing NSCs at representative time points after implantation in surgical resection cavity. BLI scale is in radiance (ρ/s/cm2/sr) with limits set at 2 × 10⁴ to 2 × 10⁶. (B) Efficacy of NSC implant method comparing DI to NSC seeded on fast degrading and slow degrading scaffolds. Data presented as mean ± standard deviation. Statistical significance measured by ANOVA with Tukey’s multiple comparison post-test. *P < 0.05 and **P < 0.005 with respect to DI. (C) BLI signal of NSCs in the brain normalized to background over time. Data presented as mean ± standard error of the mean. An ANOVA was done to determine significance of the AUC. **P < 0.005 with respect to DI. (D) Kaplan-Meier curve of NSC clearance from the brain comparing DI to NSCs seeded on fast and slow degrading scaffolds. Clearance was defined as BLI signal dropping below a 15% threshold. Log-rank (Mantel-Cox) test was done to determine statistical significance. *P < 0.05, **P < 0.005 with respect to DI. (E) Average radiance of NSCs at day 120 showing NSC implant efficiency. Data presented as mean ± standard deviation. Statistical significance measured by ANOVA with Tukey’s multiple comparison post-test. *P < 0.05 with respect to DI.