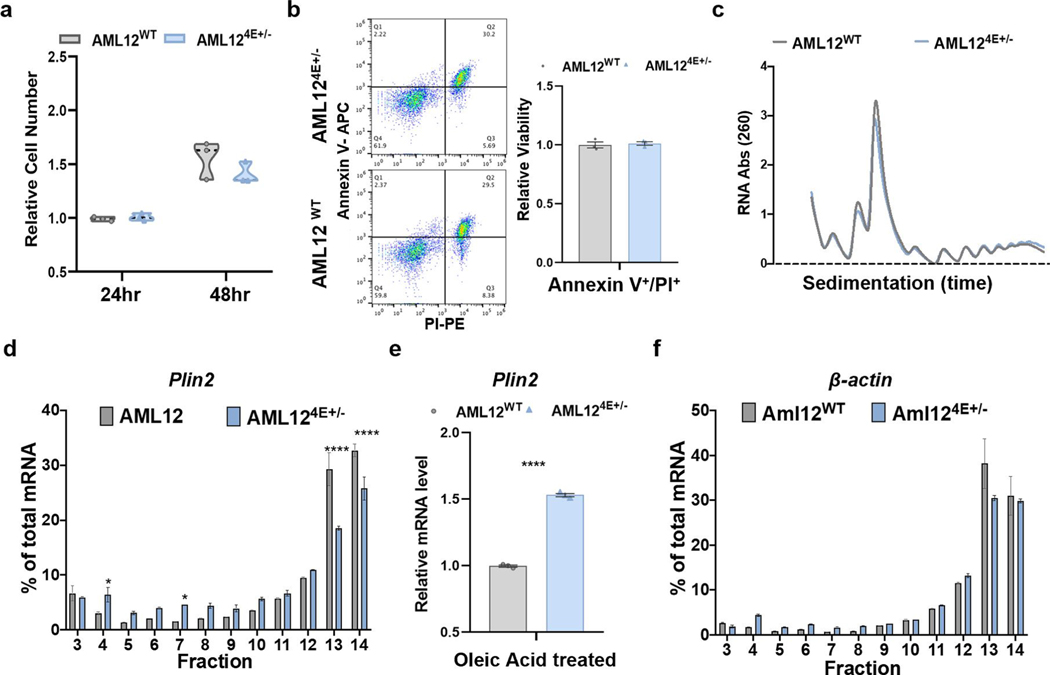
Extended Data Fig. 4 |. eIF4E dose has select metabolic effects, altering lipolysis but not lipid uptake.
a, Relative proliferation at indicated time points in AML12 cells (n = 3, 3). Violin plots show all independent replicates with the median as a dotted black line and the upper and lower quartiles as light grey lines. b, Representative flow plots from AML12 cells stained with AnnexinV and PI, left, with relative viability quantified, right (n = 3, 3 independent replicates). c, Representative polysome profile from AML12 cells. d, Representative qPCR analysis of Plin2 mRNA isolated from sucrose gradient fractions of AML12WT and AML124e+/− cells treated with oleic acid for 4 hr. Values correspond to the percentage of total mRNA across the fractions with free ribosomal subunits correspond to fractions 3–5, 80 S monosome or low polysome fractions 6–10, and high polysomes within fractions 11–14 (n = 3, 3 technical replicates, mean ± SeM, *P < 0.05; ****P < 0.0001 by unpaired, two-tailed Student’s t test). e, qPCR analysis of Plin2 mRNA of AML12WT and AML124e+/− cells treated with oleic acid for 4 hours (n = 3, 3 independent replicates, mean ± SeM, ****P < 0.00004 unpaired, two-tailed Student’s t test). f, Representative qPCR analysis of β-actin mRNA isolated from sucrose gradient fractions (n = 3, 3 technical replicates).

