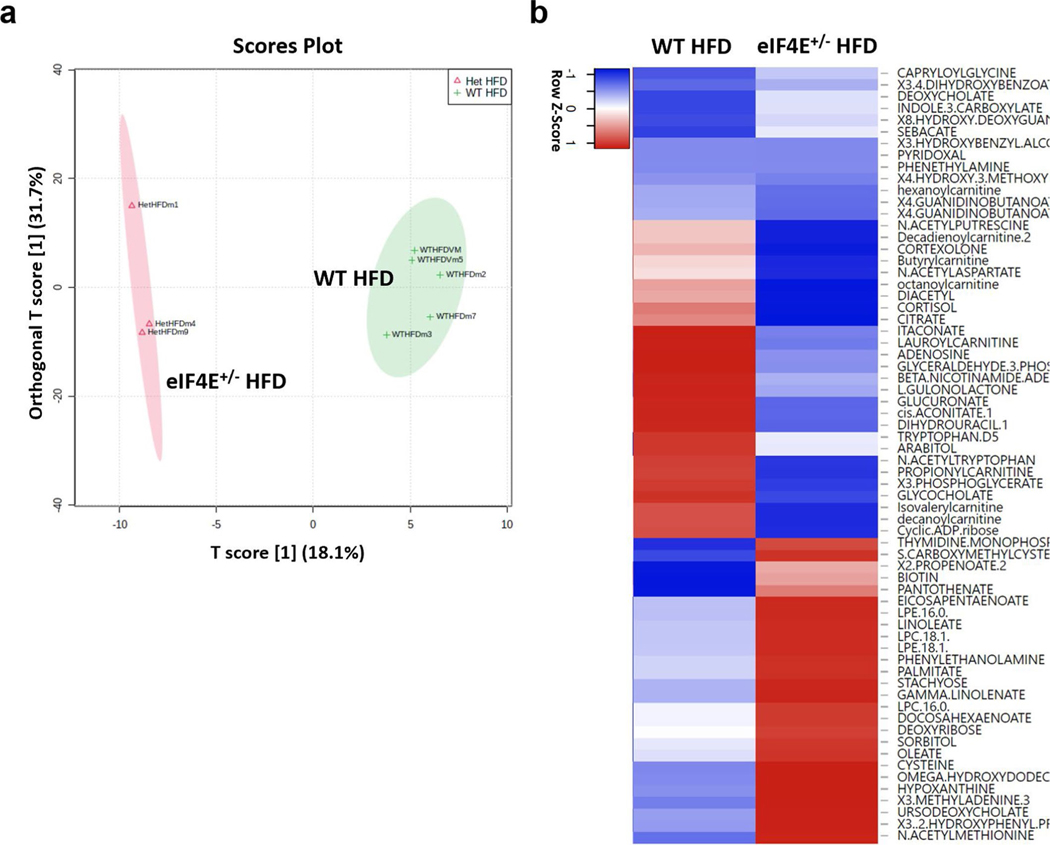
Extended Data Fig. 6 |. Metabolomics grouping by genotype highlighting top altered detected compounds.
a, Ortho PLS-DA plots each point represents an individual sample of mouse liver from 20 weeks on HFD, and how similar that sample is per all detected compounds compared to others run. eIF4e+/− liver samples clustered similar and separate from WT liver samples (n = 3, 5 respectively). b, Heatmap depicting the top 10% of metabolites increased or decreased across those detected (64/320). Lipids and carnitines showed strongest trend.

