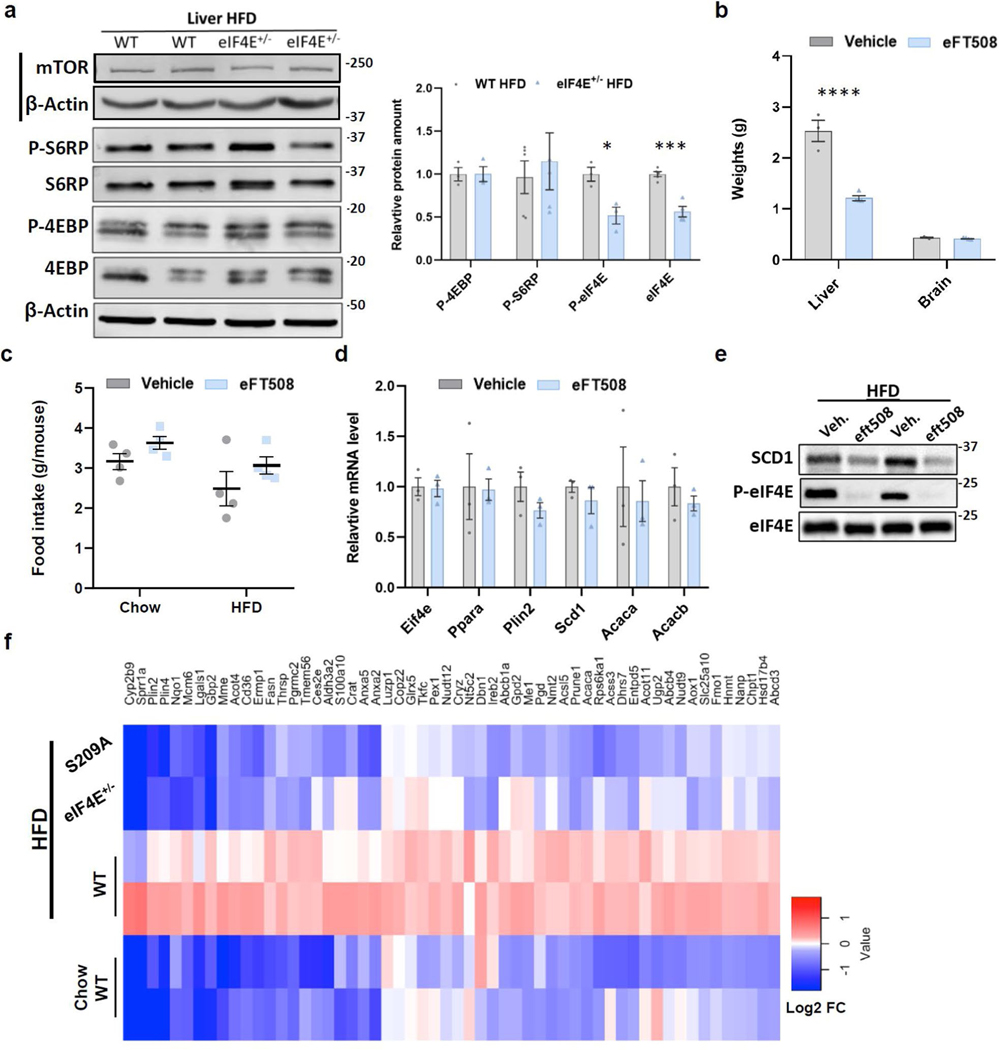
Extended Data Fig. 9 |. Genetic loss of eIF4E S209 or eFT508 treatment during HFD prevents weight gain in liver tissue.
a, Representative immunoblots for mTOR signaling. Same samples were loaded on two gels to capture large and small proteins (blots marked by vertical black line), left, and quantification, right, in indicated samples (n = 3 or more independent biological samples). Data represents mean ± SeM, *P = 0.019; ***P = 0.0002 by unpaired, two-tailed Student’s t test. b, Liver tissue or Brain (control tissue) weight from mice after 18 weeks on HFD with either Vehicle or eFT508 treatment (n = 3, 4 independent biological samples); mean ± SeM, ****P < 0.0001, unpaired, two-tailed Student’s t test. c, Food intake, average per day, per mouse on either Chow or HFD with Vehicle or eFT508 (n = 4, 4). d, qPCR analysis of relative mRNA levels of labelled transcripts in Vehicle or eFT508 treated (n = 3, 3) liver on HFD for 20 weeks, β-actin was used as internal control. e, Representative immunoblots between treatment, protein amount was quantified independently by Mass spectral analysis (n = 3, 3 independent biological replicates). f, Heatmap of depicted relative expression color coded log2 (fold change) (Log2FC) across independent biological samples from WT, eIF4e+/−, eIF4eS209A livers as labeled.

