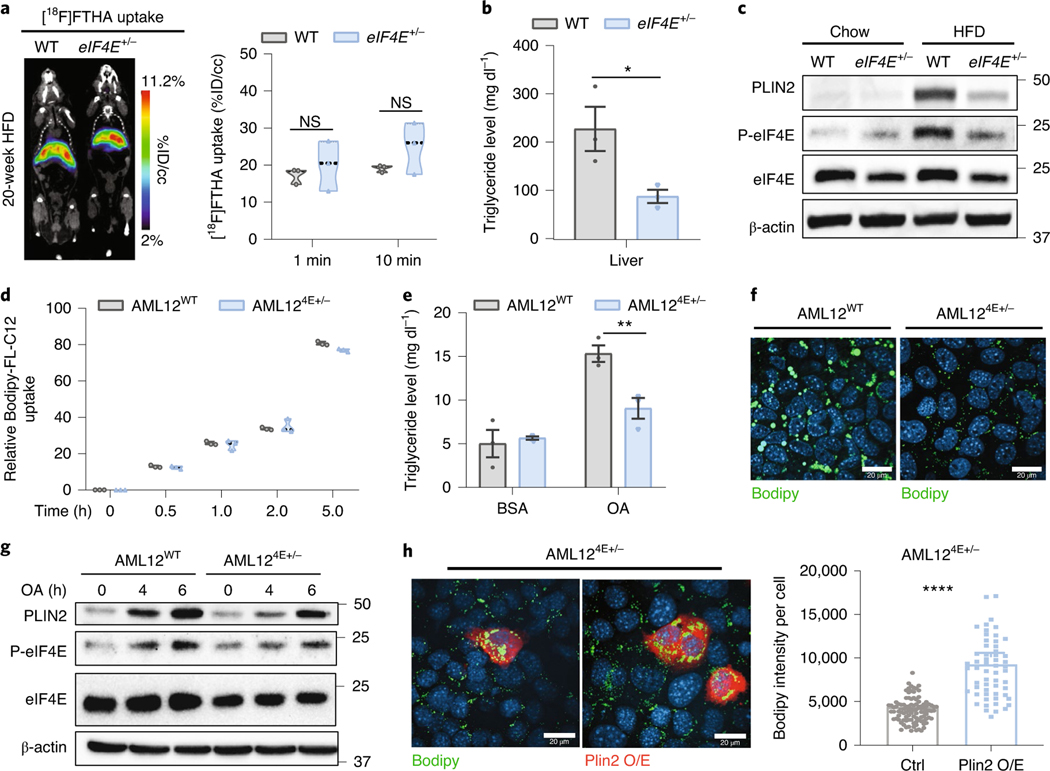
Fig. 4 |. Dynamic lipid storage in liver cells in relation to eIF4E activity.
a, Representative [18F]FTHA in mice after 20 weeks on HFD, by PeT scan. Left: images were acquired by dynamic progression over 1 h; images taken over the first 1–10 min were overlayed after administration (percent injected dose per cubic centimeter (%ID/cc)). Right: average uptake is quantified based on dose per mouse (n = 3, 3 independent biological replicates, P > 0.05, unpaired, two-tailed Student’s t-test). NS, not significant. b, Liver triglyceride levels after 20 weeks on HFD (n = 3, 3 independent biological replicates; *P = 0.043, unpaired, two-tailed Student’s t-test). c, Immunoblots depicting PLIN2, eIF4e and S209 phosphorylated eIF4e levels between chow- and HFD-fed WT and eIF4E+/− livers. d, Relative cellular Bodipy-FL-C12 intensity in AML12WT and AML124e+/− cells after incubation with Bodipy-FL-C12 for 0, 0.5, 1, 2 and 5 h. The intensity of Bodipy-FL-C12 was normalized by protein concentration (n = 3, 3 independent replicates). e, Cellular triglyceride levels in AML12 cell lines under BSA- or BSA-oleic acid-treated (OA) conditions (n = 3, 3 independent replicates; **P = 0.01, unpaired, two-tailed Student’s t-test). f, Representative images of AML12WT and AML124e+/− cells stained with bodipy (green) to monitor lipid storage after overnight treatment, repeated in at least three independent replicates. g, Immunoblots in AML12WT and AML124e+/− cells following oleic acid (OA) treatment for 0, 4 and 6 h. h, Two representative images of AML124e+/− cells transfected with Flag-tagged Plin2 cDNA and co-stained with bodipy (green; left) or Flag (Plin2 overexpression (O/e), red; right). Quantification of bodipy intensity per cell in AML124e+/− cells without (ctrl) and with Plin2 cDNA overexpression (Plin2 O/e) (n = 98, 57 individual cells counted; ****P < 0.0001, unpaired, two-tailed Student’s t-test). For violin plots all data are shown with median dashed black line and upper/lower quartiles as light grey line on independent replicates. For bar graphs, values represent mean ± s.e.m.

