. 2023 Mar 25;24(7):617–631. doi: 10.1631/jzus.B2200612

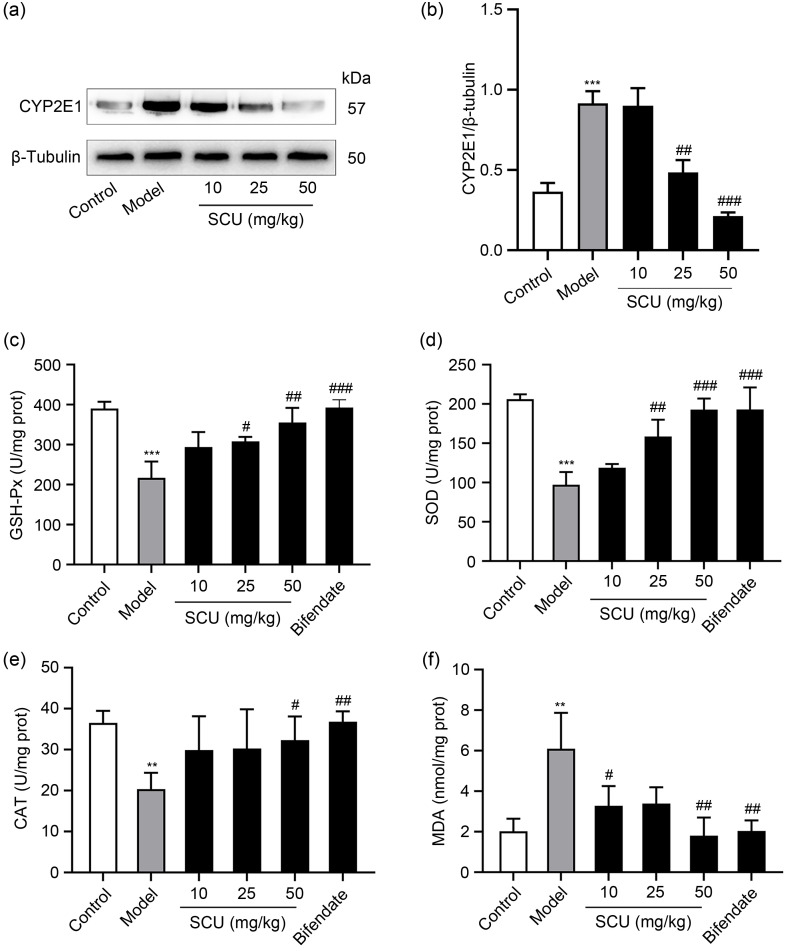
Fig. 2. Effects of SCU on CYP2E1 expression and oxidative stress in the liver of mice. (a) Protein expression of CYP2E1 in the liver analyzed by western blot. (b) Quantification of CYP2E1 protein expression in (a). GSH-Px (c), SOD (d), CAT (e), and MDA (f) levels in the liver with different treatments. All values ( n=5) are demonstrated as mean±standard deviation (SD). ** P<0.01, *** P<0.001 versus control; # P<0.05, ## P<0.01, ### P<0.001 versus model. SCU: scutellarin; CYP2E1: cytochrome P450 family 2 subfamily E member 1; GSH-Px: glutathione peroxidase; SOD: superoxide dismutase; CAT: catalase; MDA: malondialdehyde; prot: protein.

Fig. 2