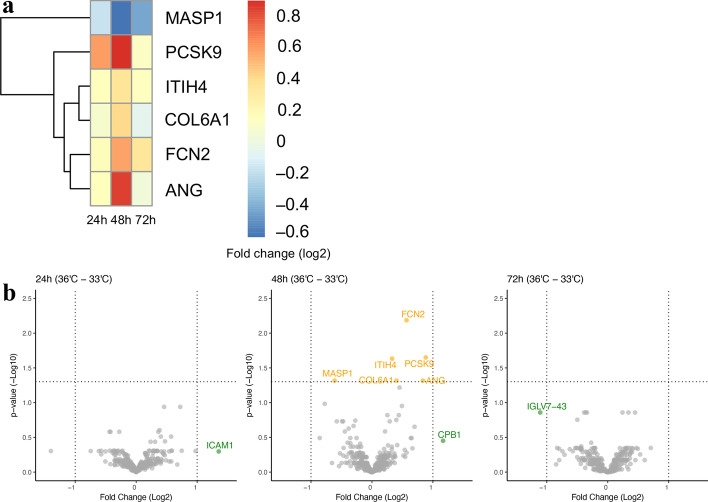
Fig. 4.
Proteomic analysis results for protein abundance according to temperature treatment of 36 °C to 33 °C. a Heatmap of the significantly differentially abundant proteins for comparison of temperature treatment of 36 °C to 33 °C at 24, 48 and 72 h after return of spontaneous circulation. Positive log2-fold change (FC) indicates elevated proteins (red colour) in patients treated at target temperature 36 °C compared to 33 °C. Negative log2(FC) indicates proteins reduced (blue colour) in patients treated at target temperature 36 °C versus 33 °C. b Volcano plots for the differential abundance of proteins between temperature treatment at 24, 48, and 72 h. Positive log2(FC) indicates treatment with 36 °C, negative log2(FC) indicates treatment with 33 °C. Proteins with a significant adjusted p-value, and with a log2(FC) between − 1 and 1 are labelled in yellow, and statistically non-significant proteins with an absolute log2(FC) < − 1 or > 1 are labelled in green. Individual protein descriptions with their biological functions are presented in Additional file 4: Table S1. ANG angiogenin; COL6A collagen alpha-1(VI) chain; CPB1 carboxypeptidase B; FCN2 Ficolin-2; ICAM1 intercellular adhesion molecule 1; IGLV7-43 immunoglobulin lambda variable 7–43; ITIH4 inter-alpha-trypsin inhibitor heavy chain family member 4; MASP1 isoform 2 of mannan-binding lectin serine protease 1; PCSK9 proprotein convertase subtilisin/kexin type 9

