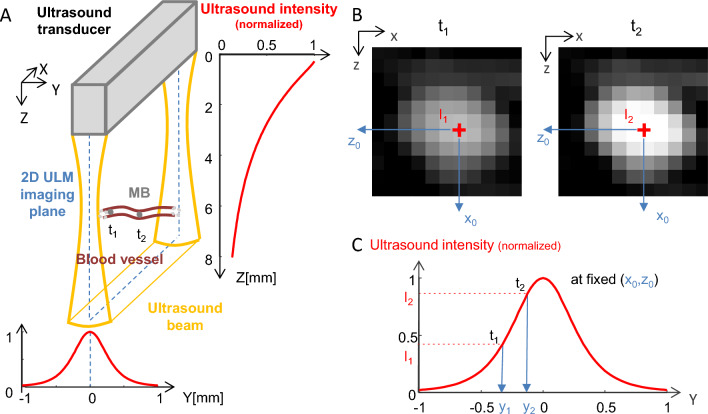
Figure 2.
MB backscattering and ultrasound beam geometry. (A) Schematic of an ultrasound beam produced by a linear array transducer and of a microbubble (MB) flowing through a blood vessel orthogonal to the imaging plane. ti: time point i. The red curves show the simulated normalized ultrasound intensity along the Z dimension (averaged along X and Y) (right) and y dimension (z = 5 mm, averaged along X) (bottom). (B) BMode images of the microbubble at t1 and t2. (C) Variation of the backscattered ultrasound intensity and consequently of the amplitude on the BMode image as a function of Y for a fixed (x0, z0) position. The red curve show the simulated normalized ultrasound intensity along the Y dimension (z = 5 mm, averaged along X).

