Figure 3.
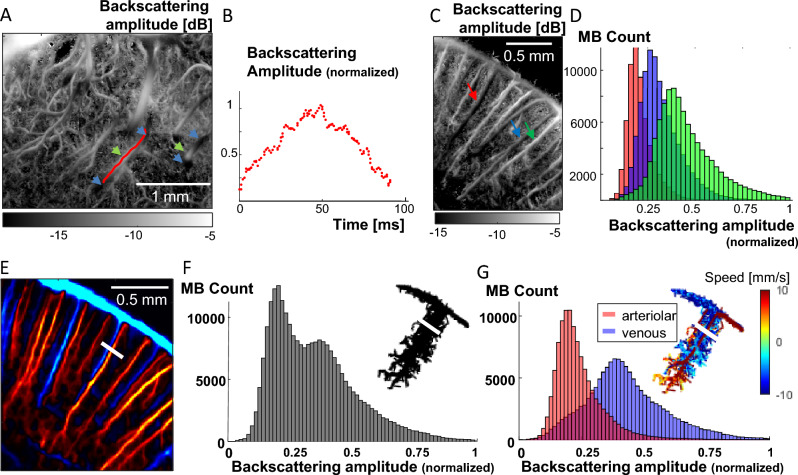
MB backscattering offers 3D information – illustrations. (A) Backscattering imaging ULM map of vessels in the rat thalamus crossing the ultrasound beam in the out of plane direction. The backscattering amplitude is low where the vessels are near the beam edges (blue arrows) and maximal when it is at the centre of the beam (green arrows). (B) Normalized backscattering amplitude as a function of time of one MB travelling in the blood vessel whose trajectory is shown on (A) as a red line. (C) Backscattering imaging ULM map of blood vessels in the rat cortex. (D) Histograms of the backscattering amplitude of all MB trajectories detected in three blood vessels pointed at by the blue, green and red arrows on (C). (E) ULM MB count map of a zoom in a rat cortex with downward flow in red and upward flow in blue (respectively arteriolar and venous flow). (F) Histogram of the backscattering amplitude of all the MB flowing through the white segment shown on (E), and related MB trajectories (top right). (G) Venous and arteriolar MB from (F) are separated based on flow direction and the histograms from their backscattering amplitude are displayed in blue and red respectively. Related MB trajectories with flow speed are displayed (top right).

