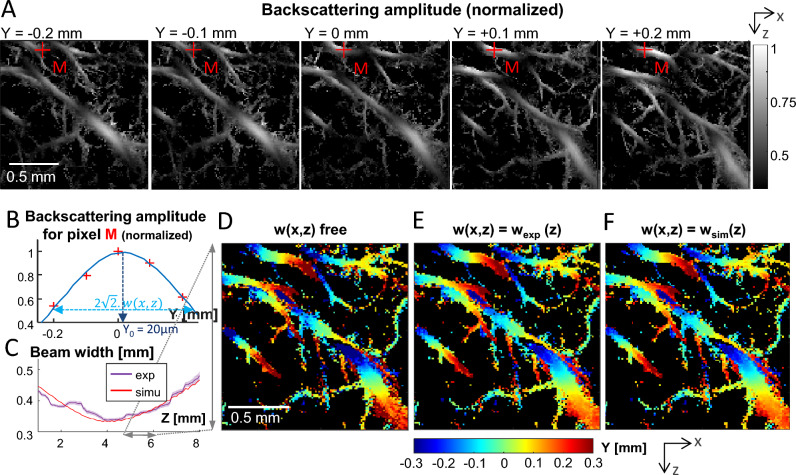
Figure 4.
2D ULM backscattering imaging and 3D sub-resolution localization. (A) 2D ULM backscattering imaging of 5 coronal planes in the rat thalamus spaced by 100 µm from each other in the elevation (Y) direction. (B) Backscattering amplitude of pixel M (red cross in (A)) for the 5 planes. The blue curves is a gaussian fit on the 5 points. y0 depicts the sub-resolution localisation of the maximum, i.e. the y-position of the vessel. (C) Violet curve: experimental gaussian fitting width parameter averaged per depth (mean + /–SEM). Red curve : beam width obtained by simulation. (D–F) Sub-resolution maps of the location (y0) in the Y (out-of-plane) direction based on a gaussian fit (width parameter = w). (D) No constraint on w. (E) Constrained width parameter w(z) obtained from experiment results (violet curve in C). (F) Constrained width parameter w(z) obtained from transducer beam simulation (red curve in C).

