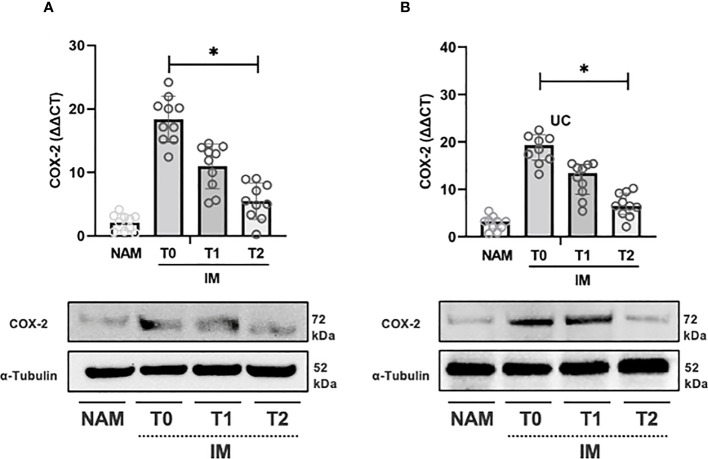
Figure 4.
RT-PCR gene expression (above) expressed as expression ratio as well as representative Western Blot (below with control of α-Tubulin) for Cyclooxygenase type 2 (COX-2) in patients with Crohn’s Disease (A) and Ulcerative Colitis (B). Data are shown for both Normal Appearing Mucosa (NAM) as well as Inflamed Mucosa (IM) both at baseline (T0) and after 120 minutes (T1) and 180 minutes (T2) of incubation with the compound under study. Significant differences in gene expression between times are expressed with “*” equal to a p-value of at least less than 0.05. Data are shown as medians and interquartile ranges.

