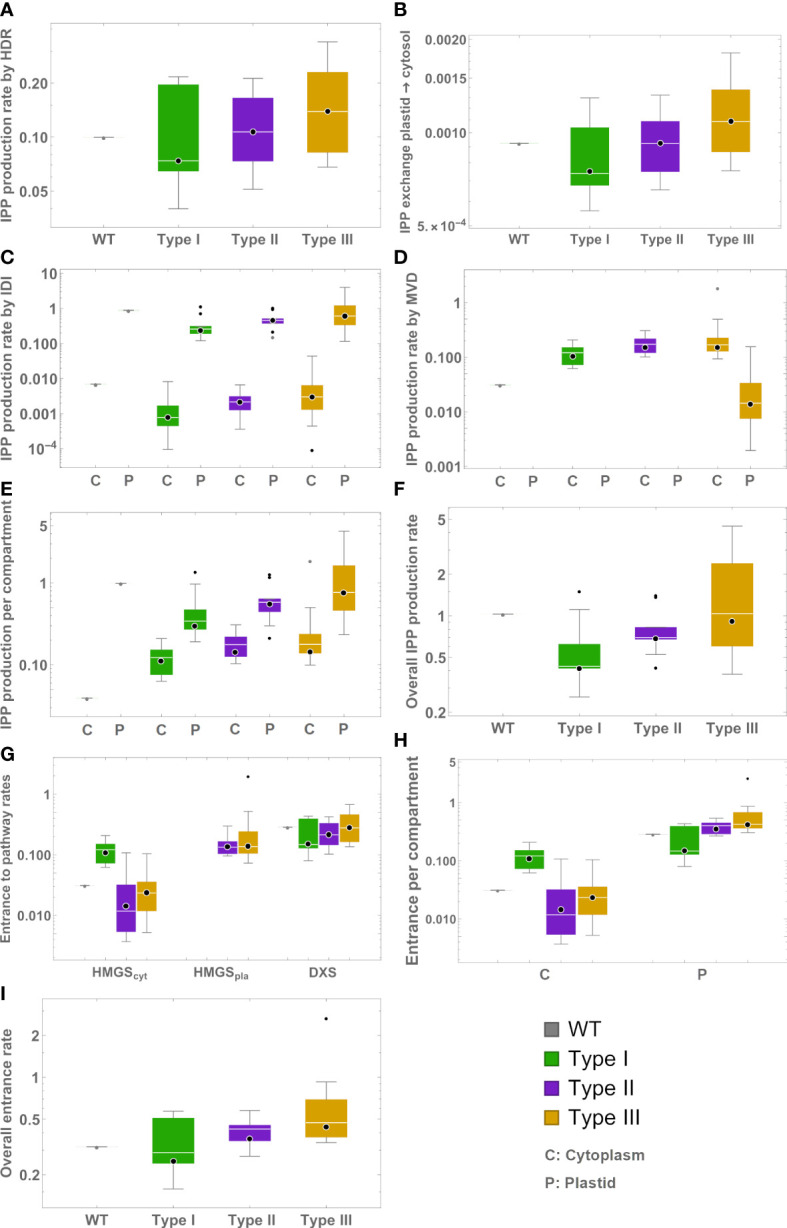
Figure 3.

Box plots representing model predictions for exchange and production rates of IPP from different sources. Green – type I mutants. Mauve – type II mutants. Gold – type III mutants. C – Production in cytosol. P – Production in plastid. (A) Production by HDR. (B) Export to the cytosol. (C) Production by IDI (D) Production by MVD. (E) Total production in each compartment. (F) Total production. (G) Entry flux to the MVA, MEP, and exogenous MVA pathways. (H) Entry flux into IPP/DMAPP production per compartment. (I) Overall flux directed for IPP/DMAPP production.
