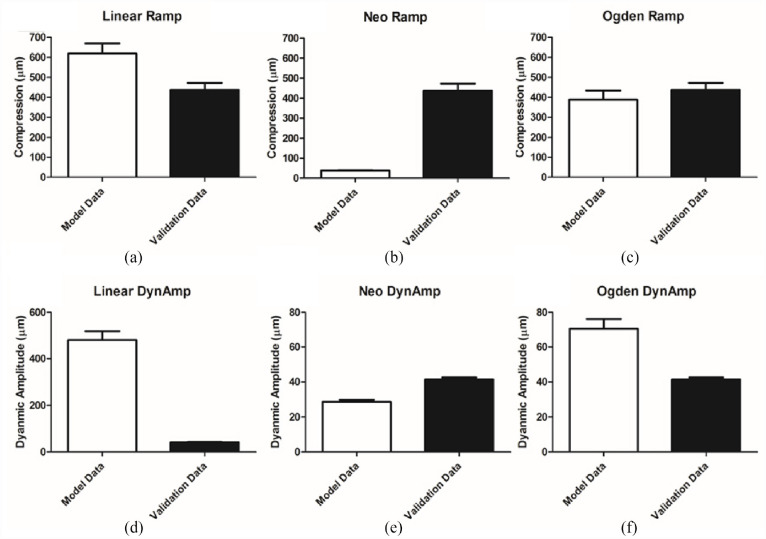
Figure 4.
FEA comparative results panel. Each of the models generated was compared to an independent data set. Results are displayed for ramp compression on linear (a), Neo-Hookean (b), and Ogden (c) models and for dynamic amplitude compression on the same models respectively (d, e, and f). Dynamic Amplitude is shorted to DynAmp for convenience (mean ± SD).

