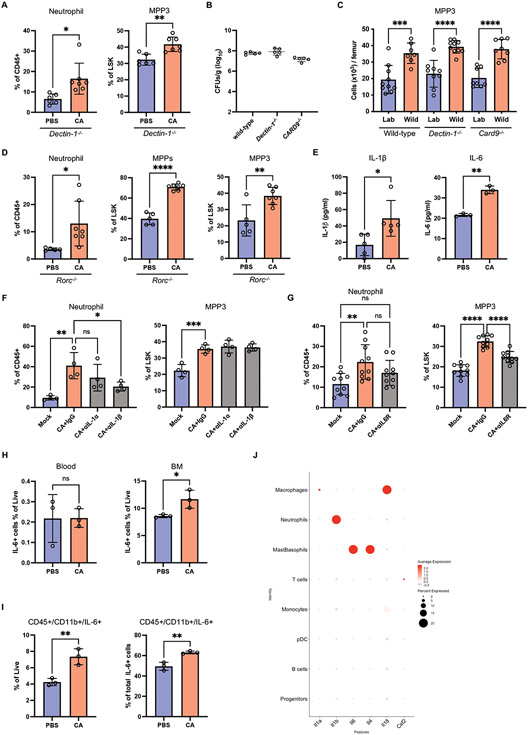
Fig. 4. Fungal colonization enhances granulopoiesis in a manner dependent on IL-6R signaling.
(A) Frequency of neutrophils in the peripheral blood and MPP3 in the BM from antibiotic-treated Dectin-1−/− mice 21 days post-inoculation with C. albicans. N = 6 PBS control and N = 7 C. albicans-colonized mice. (B) Fungal CFUs in feces from C. albicans-colonized wild-type, Dectin-1−/−, and Card9−/− mice on day 21. N = 5 mice per group. (C) Quantification of number of MPP3 in the BM of laboratory and rewilded wild-type (N = 9 lab and 7 rewilded mice), Dectin-1−/− (N = 8 lab and 10 rewilded mice), and Card9−/− (N = 8 lab and 8 rewilded mice) mice. (D) Frequency of neutrophils in the peripheral blood and MPPs and MPP3 in the BM from antibiotic-treated Rorc−/− mice 21 days post-inoculation with C. albicans. N = 5 PBS control and N = 7 C. albicans-colonized mice. (E) Quantification of IL-1β (N = 5) and IL-6 (N = 3) in the BM extracellular fluid from antibiotic-treated mice 21 days post-inoculation with PBS or C. albicans. (F) Frequency of neutrophils in the peripheral blood and MPP3 in the BM on day 7 from mice treated with anti-IL-1α, anti-IL-1β or IgG isotype control antibodies on day −1, 1, 3, and 5 days post-inoculation with C. albicans. N=4 mice per group. (G) Frequency of neutrophils in the peripheral blood and MPP3 in the BM from mice treated with anti-IL-6R or IgG isotype control antibodies on day −1, 1, 3, and 5 days post-inoculation with C. albicans. N = 10 mice per group. (H) Quantification of IL-6+ cells gated on live cells in the peripheral blood and BM from antibiotic-treated mice 21 days post-inoculation with PBS or C. albicans by flow cytometry. (I) Proportion of live IL-6+ cells that are CD45+CD11b+ (left panel) and quantification of live cells that are IL-6+ myeloid cells (CD45+CD11b+) (right panel) in the BM from antibiotic-treated mice 21 days post-inoculation with PBS or C. albicans. (J) Cytokine gene expression across cell types identified by scRNA-Seq analysis. Dots in bar graphs correspond to individual mice. Mean and SD are shown. *p < 0.05, **p < 0.01, ****p < 0.0001 by two-tailed Student’s t test between groups (A, D, E, H) and ordinary one-way analysis of variance (ANOVA) with Holm-Sidak multiple comparisons test (C, F-G). ns, not significant. Antibiotic-treated groups (A, D-I).

