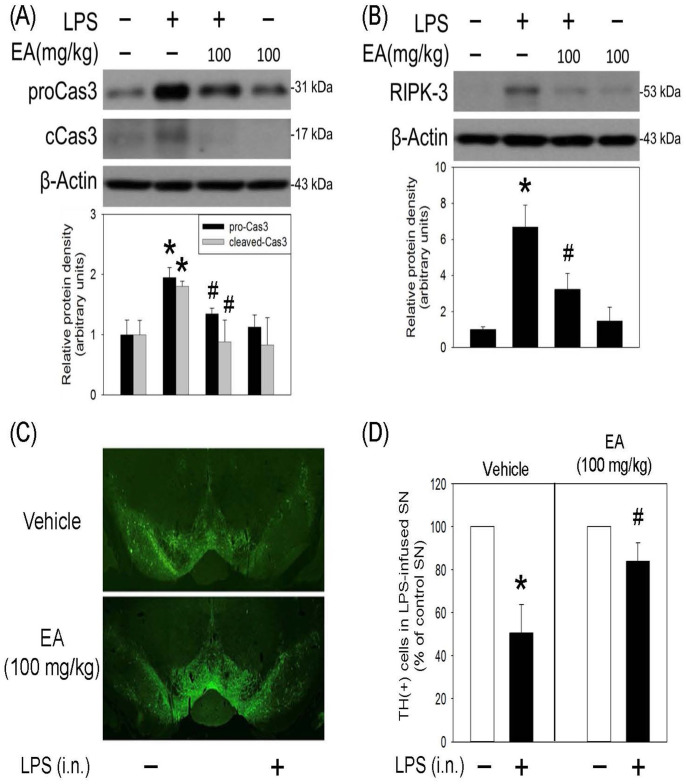
Figure 5.
Ellagic acid inhibited LPS-induced programmed cell death in rat SN. LPS (4 μg/μL) was locally infused in the SN of anesthetized rats. Oral administration of ellagic acid (EA) was performed for seven days. Protein levels of (A) procaspase 3 and cleaved-caspase 3 as well as (B) RIPK3 in SN were measured by the western blot assay. Graphs show statistical results from relative optical density of bands on the blots estimated by the Image J software. Values are the mean ± SEM (n = 3/group). *P < 0.05 in the LPS group compared with the control group; #P < 0.05 in LPS plus EA group compared with LPS group by t-test. Similar results were observed in duplicates. (C) Representative confocal microscopic data showed TH-positive neurons in the SN of rat. (D) Statistical data showed TH-positive cells in SN receiving intranigral infusion (i.n.) of LPS were counted and expressed as % of that in the contralateral intact SN of the same rat. Values are the mean ± SEM (n = 3/group). *P < 0.05 in the LPS group compared with the control group; #P < 0.05 in LPS plus EA group compared with LPS group by one-way ANOVA and t-test.

