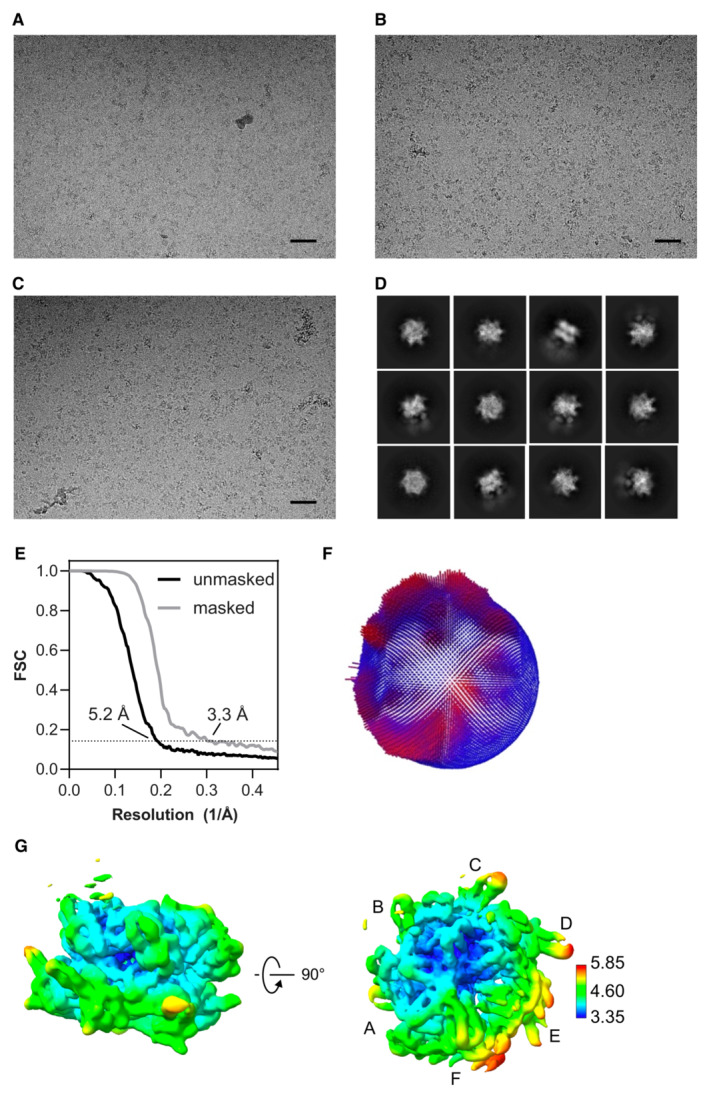
Figure EV2. Cryo EM data and map validation for p97.

-
A–CExample raw images from the particle dataset. Scale bar, 500 Å.
-
DExample 2D class averages, showing some different particle orientations, with some weak substrate densities adjacent to the stronger p97 features. The box size is 352 × 352 Å.
-
EGold‐standard Fourier shell correlation (GSFSC) calculated during refinement without and with mask. The resolutions were determined at FSC = 0.143 (dotted line).
-
FPlot of particle orientations.
-
GLocal resolution was calculated from the half‐map and colored according to the scale on the side. p97 subunits A–F labeled. For this map 866,937 particles were used.
