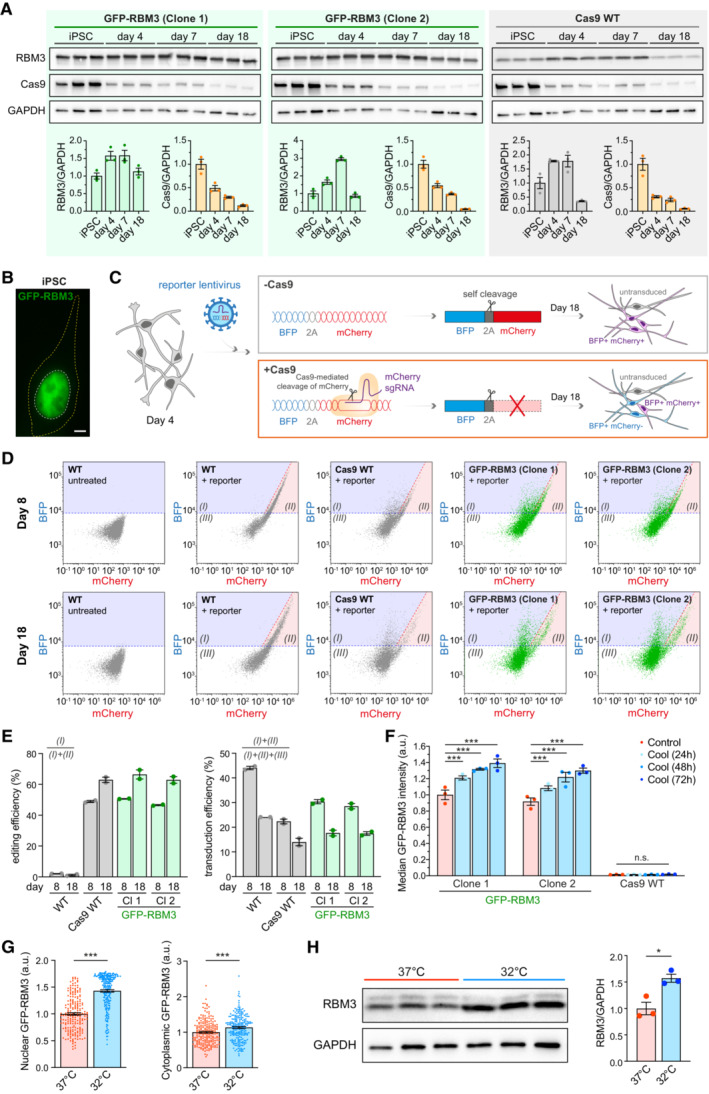
Figure EV1. Characterisation of GFP‐RBM3 human iPSC reporter line for CRISPR knockout screen. Related to Fig 1 .

- Western blots and quantification of RBM3, Cas9 and GAPDH in two GFP‐RBM3 clones and Cas9 WT iPSCs and i‐neurons 4, 7 and 18 days after dox‐induced differentiation.
- Representative image of GFP‐RBM3 iPSCs. The nucleus and soma are outlined by white and yellow dashed lines, respectively. Scale bar: 5 μm.
- Schematic of the reporter lentivirus design and expected fluorescent protein expression in transduced WT (‐Cas9) and Cas9 WT (+Cas9) i‐neurons. Transduced WT i‐neurons (top grey box) show high levels of BFP and mCherry. Transduced Cas9 WT i‐neurons (bottom orange box) that are successfully edited by the mCherry sgRNA express reduced levels of mCherry compared to the unedited ones.
- Representative BFP vs. mCherry plots measured by flow cytometry for measuring editing and transduction efficiency in WT, Cas9 WT, two clones of GFP‐RBM3 i‐neurons 4 days (Day 8) and 14 days (Day 14) after reporter lentivirus transduction. Region (I), (II) and (III) denote BFP+/mCherry‐, BFP+/mCherry+ and BFP‐/mCherry‐ populations, respectively.
- Editing and transduction efficiency of WT, Cas9 WT, two clones of GFP‐RBM3 i‐neurons at day 8 and 18 post differentiation. The calculation is based on the cell numbers within each area labelled in (D) and the formulas are shown in the graph.
- Median GFP intensity of two GFP‐RBM3 clones and Cas9 WT i‐neurons at 37°C or at 32°C for 24‐72 h, measured by flow cytometry.
- Nuclear and cytoplasmic GFP intensity per unit area in GFP‐RBM3 i‐neurons at 37 or 32°C (72 h). Each data point represents one cell.
- Western blots and quantification of RBM3 normalised to GAPDH in Cas9 WT i‐neurons at 37 or 32°C (72 h).
Data information: N = 3 biological replicates, except (E), which has N = 2. Mean ± SEM; n.s. (not significant), *(P < 0.05), ***(P < 0.001); one‐way ANOVA with multiple comparisons in (F), unpaired t‐tests in (G) and (H).
Source data are available online for this figure.
